Contenu principal

Résultats pour

Edward
Edward
Dernière activité le 3 Avr 2024

The cloks have changed in the UK having gone forward 1 hour but the times on the thingspeak graphs are out an hour - what is the solution please
Gabriel
Gabriel
Dernière activité le 29 Mar 2024

I keep getting this error, what do I do?
Error: File: convert_mnist_to_mat.m Line: 63 Column: 1
This statement is not inside any function.
(It follows the END that terminates the definition of the function
"read_mnist_labels".)
function convert_mnist_to_mat(mnist_dir, output_file)
% Function to convert MNIST dataset files into .mat format
% Check if the directory exists
if ~isfolder(mnist_dir)
error('MNIST directory does not exist.');
end
% Read training images
train_images = read_mnist_images(fullfile(mnist_dir, 'train-images-idx3-ubyte'));
% Read training labels
train_labels = read_mnist_labels(fullfile(mnist_dir, 'train-labels-idx1-ubyte'));
% Read test images
test_images = read_mnist_images(fullfile(mnist_dir, 't10k-images-idx3-ubyte'));
% Read test labels
test_labels = read_mnist_labels(fullfile(mnist_dir, 't10k-labels-idx1-ubyte'));
% Save data into .mat file
save(output_file, 'train_images', 'train_labels', 'test_images', 'test_labels');
disp('MNIST dataset converted successfully.');
end
function images = read_mnist_images(filename)
% Function to read MNIST image data
fid = fopen(filename, 'rb');
assert(fid ~= -1, ['Could not open ', filename, '']);
magic_number = fread(fid, 1, 'int32', 0, 'ieee-be');
assert(magic_number == 2051, ['Invalid magic number in ', filename]);
num_images = fread(fid, 1, 'int32', 0, 'ieee-be');
num_rows = fread(fid, 1, 'int32', 0, 'ieee-be');
num_cols = fread(fid, 1, 'int32', 0, 'ieee-be');
images = fread(fid, [num_rows, num_cols, num_images], 'uint8');
fclose(fid);
images = permute(images, [2, 1, 3]); % Convert from (rows, cols, images) to (cols, rows, images)
end
function labels = read_mnist_labels(filename)
% Function to read MNIST label data
fid = fopen(filename, 'rb');
assert(fid ~= -1, ['Could not open ', filename, '']);
magic_number = fread(fid, 1, 'int32', 0, 'ieee-be');
assert(magic_number == 2049, ['Invalid magic number in ', filename]);
num_labels = fread(fid, 1, 'int32', 0, 'ieee-be');
labels = fread(fid, [num_labels, 1], 'uint8');
fclose(fid);
end
% Usage example:
mnist_dir = 'C:\Users\gabep\Desktop\MNIST';
output_file = 'mnist_dataset.mat';
convert_mnist_to_mat(mnist_dir, output_file);
Alberto
Alberto
Dernière activité le 28 Mar 2024

Hi everyone, I need help for transfering the data from a ThingSpeak' channel to Google Sheets. Please help me.
Cunxin Huang
Cunxin Huang
Dernière activité le 18 Avr 2024

Suppose I want to use tiledlayout to draw a 4*6 figure. Now I want to let the first and second row of figures share the same ylabels, and so do the third and the fourth. But I did not find a way to do this. I tried to create two different tiledlayout on one figure, but tiledlayout did not allow me to do so. Thus, any suggestions?

Englisch Translate Französisch Deutsch Deutsch Russisch PONS Deepl übersetzer Spanisch Deutsch DeepL kostenlos Deutsch Englisch hallo, ich bitte um Hilfe! Seit Jahren habe ich Konto auf Thingspeak, den ich für meinen Zweck nicht richtig nutzen kann. Ich kann "Upoad to meine private Chanel", aber das lesen funktioniert nicht, weder in ArdunioIDE, noch Ardunio iot kann ich die gesendete Daten (Temperatur) von einem anderen Board lesen, es ist egal, ob ESP8266, ESP32, MKR, oder UnoWifi Rev2. Nichts! Die Beispiele im Bibliotek sind eine Katastrophe, "wetter-chanel" und diese funktionieren auch nicht. Auch nicht die von GitHub. Es sollte aber einfach sein, denn auf meiner Seite sehe ich ja "GET"+ url. inkl json+result.

Wo gibt es eine richtige sketch für "read private chanel/field" , welche funktioniert? Man braucht nicht die Wifi-Enstellungen, sondern den code für die Abfrage, "Serial.print"(value)"

Bitte um Hilfe, danke schön.

hello, I ask for help! I've had an account on Thingspeak for years, but I can't use it properly for my purpose. I can "Upoad to my private Chanel", but reading doesn't work, neither in ArdunioIDE nor Ardunio iot can I read the sent data (temperature) from another board, it doesn't matter whether ESP8266, ESP32, MKR, or UnoWifi Rev2. Nothing! The examples in the library are a disaster, "weather-chanel" and they don't work either. Not even the one from GitHub. But it should be easy, because on my site I see “GET”+ url. including json+result.

Where is there a proper sketch for "read private chanel/field" that works? You don't need the WiFi settings, but the code for the query, "Serial.print"(value)"

Please help, thank you very much.

Hello Everyone,
I'm running an IoT project at my university using a free . Basically, my system uploads the sensor data to 4 different fields of a ThingSpeak channel and I'm reading from or writing to the channel through Simulink. I have a few questions regarding this topic:
  1. I'm trying to upload to the server every 3 seconds (which seemed to be providing the best results so far). Since the channel only accepts data transmit every 15 seconds, what is the optimized upload interval rate to match the interval rate of the channel? Because otherwise I have realized that my interval rate can go up to 1min sometimes for some reason.
  2. Is reading from/writing to the channel through simulink while the system is uploading data to the channel slow down th whole process? What is your overall suggestion in this case?
I'm excited to hear your suggestions and experiences!
Regards,
Ege
I would like to propose the creation of MATLAB EduHub, a dedicated channel within the MathWorks community where educators, students, and professionals can share and access a wealth of educational material that utilizes MATLAB. This platform would act as a central repository for articles, teaching notes, and interactive learning modules that integrate MATLAB into the teaching and learning of various scientific fields.
Key Features:
1. Resource Sharing: Users will be able to upload and share their own educational materials, such as articles, tutorials, code snippets, and datasets.
2. Categorization and Search: Materials can be categorized for easy searching by subject area, difficulty level, and MATLAB version..
3. Community Engagement: Features for comments, ratings, and discussions to encourage community interaction.
4. Support for Educators: Special sections for educators to share teaching materials and track engagement.
Benefits:
- Enhanced Educational Experience: The platform will enrich the learning experience through access to quality materials.
- Collaboration and Networking: It will promote collaboration and networking within the MATLAB community.
- Accessibility of Resources: It will make educational materials available to a wider audience.
By establishing MATLAB EduHub, I propose a space where knowledge and experience can be freely shared, enhancing the educational process and the MATLAB community as a whole.
Product Models:LPS8N dragino
Firmware Version: lgw--build-v5.4.1704801796-20240109-2005
Hi all
at the moment i can not work with CODE dragino lora to gateway LPS8N and MQTT thingSpeak.
with root commands i can send DATA to thingspeak
mosquito_pub -d -h mqtt3.thingspeak.com -p 1883 -u PSoyJxYWBTQ9Hx8cExMZ... -I PSoyJxYWBTQ9Hx8cExM.... -P hCEd77jdiziYzUV6ygl.... -t channels/2466703/publish -m “field1=100&field2=100&status=MQTTPUBLISH”
so my question there anybody that can work with LPS8N dragino to MQTT ThingSpeak? which code arduino are using?
thanks in advance to answer.
Nelson
I am considering to use ThingSpeak for my use case which is electric motor drive where I want to do a predictive maintanace for.
Is it possible to use ThingSpeak to develop and evaluate the AI/ML model for such purpose and the deploy on realtime microcontroller?
Pranab
Pranab
Dernière activité le 13 Mar 2024

Dear Sir,
Is Thingspeak support jason data format???
When I am sending data in plain text fiom MQTTX, I see it in dashboard but in JASON format it is not showing in dashboard.
This Arduino ino sketch utilizes the new Arduino R4 with LED matrix. I use a thermistor to measure temperature and send it to the led MAtrix for local display and also to ThingSpeak for cloud display at public
  • Channel ID: 2300884
Note: I used Christopher's suggestion (elsewhere) to start with the Arduino R4 wifi example in the example folder of the Arduino IDE. That made all the difference in the world! Plus, I had serious issues with "write" data until I watched this YouTube video.
I have a development that requires 12 fields, but ThingSpeak only offers 8. Without further subscription, can I combine 2 Channels ?
I've read thru the API refernce doc and the information in the right-hand side panel on "API Keys" tab and so I 'm pretty sure the answer is "no" but throught it was worth double-checking.
My application for this is that I have several devices, each with their own channel. For security, I'd like them to be able to deduce or calculate the write API key to their channel based on their device serial number (which each device knows) so that I don't have to store the API key in their firmware.
thanks...
Hello, I am using an Arduino UNO R3 with an ESP8266 WiFi Shield to connect 2 DHT-11 sensors to upload their data to ThingSpeak. Sometimes ThingSpeak would only post data on a certain sensor for a bit and then upload to the other randomly. I want ThingSpeak to pick up the sensors within 30-40 seconds of each other consistently. I believe there might be something wrong with my code. I was hoping to get some help on it. Anything is appreciated.
Below is provided code
SoftwareSerial esp8266(RX,TX);
void setup() {
Serial.begin(9600);
esp8266.begin(38400);
sendCommand("AT",5,"OK");
sendCommand("AT+CWMODE=1",5,"OK");
sendCommand("AT+CWJAP=\""+ AP +"\",\""+ PASS +"\"",20,"OK");
}
void loop() {
String getData = "GET /update?api_key="+ API +"&field1="+getTemperatureValue()+"&field2="+getHumidityValue();
sendCommand("AT+CIPMUX=1",5,"OK");
sendCommand("AT+CIPSTART=0,\"TCP\",\""+ HOST +"\","+ PORT,15,"OK");
sendCommand("AT+CIPSEND=0," +String(getData.length()+4),4,">");
esp8266.println(getData);delay(6000);countTrueCommand++;
String getData2 = "GET /update?api_key="+ API +"&field3="+getTemperatureValue2()+"&field4="+getHumidityValue2();
sendCommand("AT+CIPMUX=1",5,"OK");
sendCommand("AT+CIPSTART=0,\"TCP\",\""+ HOST +"\","+ PORT,15,"OK");
sendCommand("AT+CIPSEND=0," +String(getData2.length()+4),4,">");
esp8266.println(getData2);delay(6000);countTrueCommand++;
sendCommand("AT+CIPCLOSE=0",5,"OK");
}
String getTemperatureValue(){
dhtObject.read(dht_apin);
Serial.print(" Temperature(C)= ");
int temp = dhtObject.temperature;
Serial.println(temp);
delay(50);
return String(temp);
}
String getHumidityValue(){
dhtObject.read(dht_apin);
Serial.print(" Humidity in %= ");
int humidity = dhtObject.humidity;
Serial.println(humidity);
delay(50);
return String(humidity);
}
String getTemperatureValue2(){
dhtObject2.read(dht_bpin);
Serial.print(" Temperature(C)= ");
int temp2 = dhtObject2.temperature;
Serial.println(temp2);
delay(50);
return String(temp2);
}
String getHumidityValue2(){
dhtObject2.read(dht_bpin);
Serial.print(" Humidity in %= ");
int humidity2 = dhtObject2.humidity;
Serial.println(humidity2);
delay(50);
return String(humidity2);
}
void sendCommand(String command, int maxTime, char readReplay[]) {
Serial.print(countTrueCommand);
Serial.print(". at command => ");
Serial.print(command);
Serial.print(" ");
while(countTimeCommand < (maxTime*1))
{
esp8266.println(command);//at+cipsend
if(esp8266.find(readReplay))//ok
{
found = true;
break;
}
countTimeCommand++;
}
if(found == true)
{
Serial.println("Pass");
countTrueCommand++;
countTimeCommand = 0;
}
if(found == false)
{
Serial.println("Fail");
countTrueCommand = 0;
countTimeCommand = 0;
}
found = false;
}
Several of the colormaps are great for a 256 color surface plot, but aren't well optimized for extracting m colors for plotting several independent lines. The issue is that many colormaps have start/end colors that are too similar or are suboptimal colors for lines. There are certainly many workarounds for this, but it would be a great quality of life to adjust that directly when calling this.
Example:
x = linspace(0,2*pi,101)';
y = [1:6].*cos(x);
figure; plot(x,y,'LineWidth',2); grid on; axis tight;
And now if I wanted to color these lines, I could use something like turbo(6) or gray(6) and then apply it using colororder.
colororder(turbo(6))
But my issue is that the ends of the colormap are too similar. For other colormaps, you may get lines that are too light to be visible against the white background. There are plenty of workarounds, with my preference being to create extra colors and truncate that before using colororder.
cmap = turbo(8); cmap = cmap(2:end-1,:); % Truncate the end colors
figure; plot(x,y,'LineWidth',2); grid on; axis tight;
colororder(cmap)
I think it would be really awesome to add some name-argument input pair to these colormaps that can specify the range you want so this could even be done inside the colororder calling if desired. An example of my proposed solution would look something like this:
cmap = turbo(6,'Range',[0.1 0.8]); % Proposed idea to add functionality
Where in this scenario, the resulting colormap would be 6 equally spaced colors that range from 10% to 80% of the total color range. This would be especially nice because you could more quickly modify the range of colors, or you could set the limits regardless of whether you need to plot 3, 6, or 20 lines.
Sarati
Sarati
Dernière activité le 29 Fév 2024

Due to temporary problem MathWorks account was unable to login. Kindly resolve this issue.

KAVYA
KAVYA
Dernière activité le 29 Fév 2024

how to generate CA signed certificate for mqtt
When I embed Matlab windows into C#, I use C# to call the mouse functions such as drawline() and getpts() which are encapsulated in Matlab's dll, and then the program crashes, how can I solve this problem?
ps : The functions that I call in C# can be executed in Matlab.
ps : If I don't embed the window into C#, but just let C# call the Matlab function, it can execute the mouse control normally in the window, but once embedded into the C# window, it will crash when execute the mouse command.
I have a channel updating every 10 minutes. The last 8000 entries therefore go back to late December (around 55 days). I want to extend the range of data downloaded by setting a timescale between results, so say if I request a timescale of 20 minutes should I not be able to get data from twice as long ago? e.g.
https://api.thingspeak.com/channels/xxxxxx/fields/1.json?api_key=XXXXXXXXXXX&timescale=20&start=2022-12-30%2022:00:00
No matter what timescale or averaging I use, the last 8000 entries are the only ones processed for the downloaded data, so I just get fewer results. Unless I use a timescale of 1440; then I can download results from the very first entry in 2022. A timescale of 720 or lower however will only go back 55 days.
So I see the desired result when I use a timescale of 1440, but no other timescale will work. Is this a bug?
2 x 2 행렬의 행렬식은
  • 행렬의 두 row 벡터로 정의되는 평행사변형의 면적입니다.
  • 물론 두 column 벡터로 정의되는 평행사변형의 면적이기도 합니다.
  • 좀 더 정확히는 signed area입니다. 면적이 음수가 될 수도 있다는 뜻이죠.
  • 행렬의 두 행(또는 두 열)을 맞바꾸면 행렬식의 부호도 바뀌고 면적의 부호도 바뀌어야합니다.
일반적으로 n x n 행렬의 행렬식은
  • 각 row 벡터(또는 각 column 벡터)로 정의되는 N차원 공간의 평행면체(?)의 signed area입니다.
  • 제대로 이해하려면 대수학의 개념을 많이 가지고 와야 하는데 자세한 설명은 생략합니다.(=저도 모른다는 뜻)
  • 더 자세히 알고 싶으시면 수학하는 만화의 '넓이 이야기' 편을 추천합니다.
  • 수학적인 정의를 알고 싶으시면 위키피디아를 보시면 됩니다.
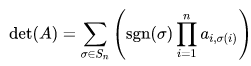
  • 이렇게 생겼습니다. 좀 무섭습니다.
아래 코드는...
  • 2 x 2 행렬에 대해서 이것을 수식 없이 그림만으로 증명하는 과정입니다.
  • gif 생성에는 ScreenToGif를 사용했습니다. (gif 만들기엔 이게 킹왕짱인듯)
Determinant of 2 x 2 matrix is...
  • An area of a parallelogram defined by two row vectors.
  • Of course, same one defined by two column vectors.
  • Precisely, a signed area, which means area can be negative.
  • If two rows (or columns) are swapped, both the sign of determinant and area change.
More generally, determinant of n x n matrix is...
  • Signed area of parallelepiped defined by rows (or columns) of the matrix in n-dim space.
  • For a full understanding, a lot of concepts from abstract algebra should be brought, which I will not write here. (Cuz I don't know them.)
  • For a mathematical definition of determinant, visit wikipedia.
  • A little scary, isn't it?
The code below is...
  • A process to prove the equality of the determinant of 2 x 2 matrix and the area of parallelogram.
  • ScreenToGif is used to generate gif animation (which is, to me, the easiest way to make gif).
% 두 점 (a, b), (c, d)의 좌표
a = 4;
b = 1;
c = 1;
d = 3;
% patch 색 pre-define
lightgreen = [144, 238, 144]/255;
lightblue = [169, 190, 228]/255;
lightorange = [247, 195, 160]/255;
% animation params.
anim_Nsteps = 30;
% create window
figure('WindowStyle','docked')
ax = axes;
ax.XAxisLocation = 'origin';
ax.YAxisLocation = 'origin';
ax.XTick = [];
ax.YTick = [];
hold on
ax.XLim = [-.4, a+c+1];
ax.YLim = [-.4, b+d+1];
% create ad-bc patch
area = patch([0, a, a+c, c], [0, b, b+d, d], lightgreen);
p_ab = plot(a, b, 'ko', 'MarkerFaceColor', 'k');
p_cd = plot(c, d, 'ko', 'MarkerFaceColor', 'k');
p_ab.UserData = text(a+0.1, b, '(a, b)', 'FontSize',16);
p_cd.UserData = text(c+0.1, d-0.2, '(c, d)', 'FontSize',16);
area.UserData = text((a+c)/2-0.5, (b+d)/2, 'ad-bc', 'FontSize', 18);
pause
%% Is this really ad-bc?
area.UserData.String = 'ad-bc...?';
pause
%% fade out ad-bc
fadeinout(area, 0)
area.UserData.Visible = 'off';
pause
%% fade in ad block
rect_ad = patch([0, a, a, 0], [0, 0, d, d], lightblue, 'EdgeAlpha', 0, 'FaceAlpha', 0);
uistack(rect_ad, 'bottom');
fadeinout(rect_ad, 1, t_pause=0.003)
draw_gridline(rect_ad, ["23", "34"])
rect_ad.UserData = text(mean(rect_ad.XData), mean(rect_ad.YData), 'ad', 'FontSize', 20, 'HorizontalAlignment', 'center');
pause
%% fade-in bc block
rect_bc = patch([0, c, c, 0], [0, 0, b, b], lightorange, 'EdgeAlpha', 0, 'FaceAlpha', 0);
fadeinout(rect_bc, 1, t_pause=0.0035)
draw_gridline(rect_bc, ["23", "34"])
rect_bc.UserData = text(b/2, c/2, 'bc', 'FontSize', 20, 'HorizontalAlignment', 'center');
pause
%% slide ad block
patch_slide(rect_ad, ...
[0, 0, 0, 0], [0, b, b, 0], t_pause=0.004)
draw_gridline(rect_ad, ["12", "34"])
pause
%% slide ad block
patch_slide(rect_ad, ...
[0, 0, d/(d/c-b/a), d/(d/c-b/a)],...
[0, 0, b/a*d/(d/c-b/a), b/a*d/(d/c-b/a)], t_pause=0.004)
draw_gridline(rect_ad, ["14", "23"])
pause
%% slide bc block
uistack(p_cd, 'top')
patch_slide(rect_bc, ...
[0, 0, 0, 0], [d, d, d, d], t_pause=0.004)
draw_gridline(rect_bc, "34")
pause
%% slide bc block
patch_slide(rect_bc, ...
[0, 0, a, a], [0, 0, 0, 0], t_pause=0.004)
draw_gridline(rect_bc, "23")
pause
%% slide bc block
patch_slide(rect_bc, ...
[d/(d/c-b/a), 0, 0, d/(d/c-b/a)], ...
[b/a*d/(d/c-b/a), 0, 0, b/a*d/(d/c-b/a)], t_pause=0.004)
pause
%% finalize: fade out ad, bc, and fade in ad-bc
rect_ad.UserData.Visible = 'off';
rect_bc.UserData.Visible = 'off';
fadeinout([rect_ad, rect_bc, area], [0, 0, 1])
area.UserData.String = 'ad-bc';
area.UserData.Visible = 'on';
%% functions
function fadeinout(objs, inout, options)
arguments
objs
inout % 1이면 fade-in, 0이면 fade-out
options.anim_Nsteps = 30
options.t_pause = 0.003
end
for alpha = linspace(0, 1, options.anim_Nsteps)
for i = 1:length(objs)
switch objs(i).Type
case 'patch'
objs(i).FaceAlpha = (inout(i)==1)*alpha + (inout(i)==0)*(1-alpha);
objs(i).EdgeAlpha = (inout(i)==1)*alpha + (inout(i)==0)*(1-alpha);
case 'constantline'
objs(i).Alpha = (inout(i)==1)*alpha + (inout(i)==0)*(1-alpha);
end
pause(options.t_pause)
end
end
end
function patch_slide(obj, x_dist, y_dist, options)
arguments
obj
x_dist
y_dist
options.anim_Nsteps = 30
options.t_pause = 0.003
end
dx = x_dist/options.anim_Nsteps;
dy = y_dist/options.anim_Nsteps;
for i=1:options.anim_Nsteps
obj.XData = obj.XData + dx(:);
obj.YData = obj.YData + dy(:);
obj.UserData.Position(1) = mean(obj.XData);
obj.UserData.Position(2) = mean(obj.YData);
pause(options.t_pause)
end
end
function draw_gridline(patch, where)
ax = patch.Parent;
for i=1:length(where)
v1 = str2double(where{i}(1));
v2 = str2double(where{i}(2));
x1 = patch.XData(v1);
x2 = patch.XData(v2);
y1 = patch.YData(v1);
y2 = patch.YData(v2);
if x1==x2
xline(x1, 'k--')
else
fplot(@(x) (y2-y1)/(x2-x1)*(x-x1)+y1, [ax.XLim(1), ax.XLim(2)], 'k--')
end
end
end