Adam Danz
MathWorks
Software engineer at MathWorks with a Ph.D. in neurophysiology from the University of Rochester (NY). Specialized in visual and vestibular systems, multisensory integration, sensory-motor and control systems, steering, and navigation. Former member of the MathWorks Community Advisory Board. *My community contributions before 14-Feb-2022 were prior to my employment at MathWorks.
He/him
Statistiques
28 Fichiers
Cody0 Problèmes
34 Solutions
35 Publications
Highlights32 Points forts
RANG
18
of 300 392
RÉPUTATION
14 356
CONTRIBUTIONS
10 Questions
3 763 Réponses
ACCEPTATION DE VOS RÉPONSES
80.0%
VOTES REÇUS
2 375
RANG
1 363 of 20 934
RÉPUTATION
1 398
CLASSEMENT MOYEN
4.80
CONTRIBUTIONS
28 Fichiers
TÉLÉCHARGEMENTS
124
ALL TIME TÉLÉCHARGEMENTS
35696
CONTRIBUTIONS
35 Publications
CONTRIBUTIONS
0 Public Chaîne
CLASSEMENT MOYEN
CONTRIBUTIONS
32 Points forts
NOMBRE MOYEN DE LIKES
8


Feeds
Publié le
WebGL: MATLAB’s New Graphics Rendering System
Guest Writer: Maddie Moon Maddie first worked with the Graphics and App Building team during her Engineering Development...
12 jours il y a

Turn off UIFigure visibility during unit test
Interaction tests using press, drag, etc, require figure visibility to be on in the App Testing Framework. Make sure you're n...
19 jours il y a | 0
| A accepté
how can I make a colored 2D-surface in a polar plot? I want to give some labels to this polar... It is possible?
Starting in R2025a, polar axes support patch and surface objects. Here's @Joseph Cheng's example applied to polar axes. Ther...
environ un mois il y a | 0
How can I fill with color a odd flower in a cartesian o polar coordinates?
Starting in R2025a, polar axes support patch and surface objects. Here's @bio lim's example applied to polar axes. There's m...
environ un mois il y a | 0
Publié le
Polar plots with patches and surfaces – R2025a
Guest Writer: Grant Marshall Grant is a software engineer on the MATLAB Graphics & Charting Team. He first joined...
environ un mois il y a

Publié le
Goodbye GUIDE, Hello App Designer: Evolving Your MATLAB Apps
Guest Writer: Sonia Sethi Sonia is a product marketer with the MATLAB Outbound Team, focused on developing technical...
environ un mois il y a

Publié le
Bridging the Gap in App Building: From uicontrol to UI Components
Guest Writer: Jasmine PoppickJasmine works in documentation at MathWorks, both as a writer for the App Building area and as...
2 mois il y a

Publié le
Creating a Flight Tracking Dashboard, Part 3: Using Modular Application Development Principles to Assemble the Dashboard
Are you ready to take your app building skills to the next level? This article walks through an advanced workflow for...
3 mois il y a

Publié le
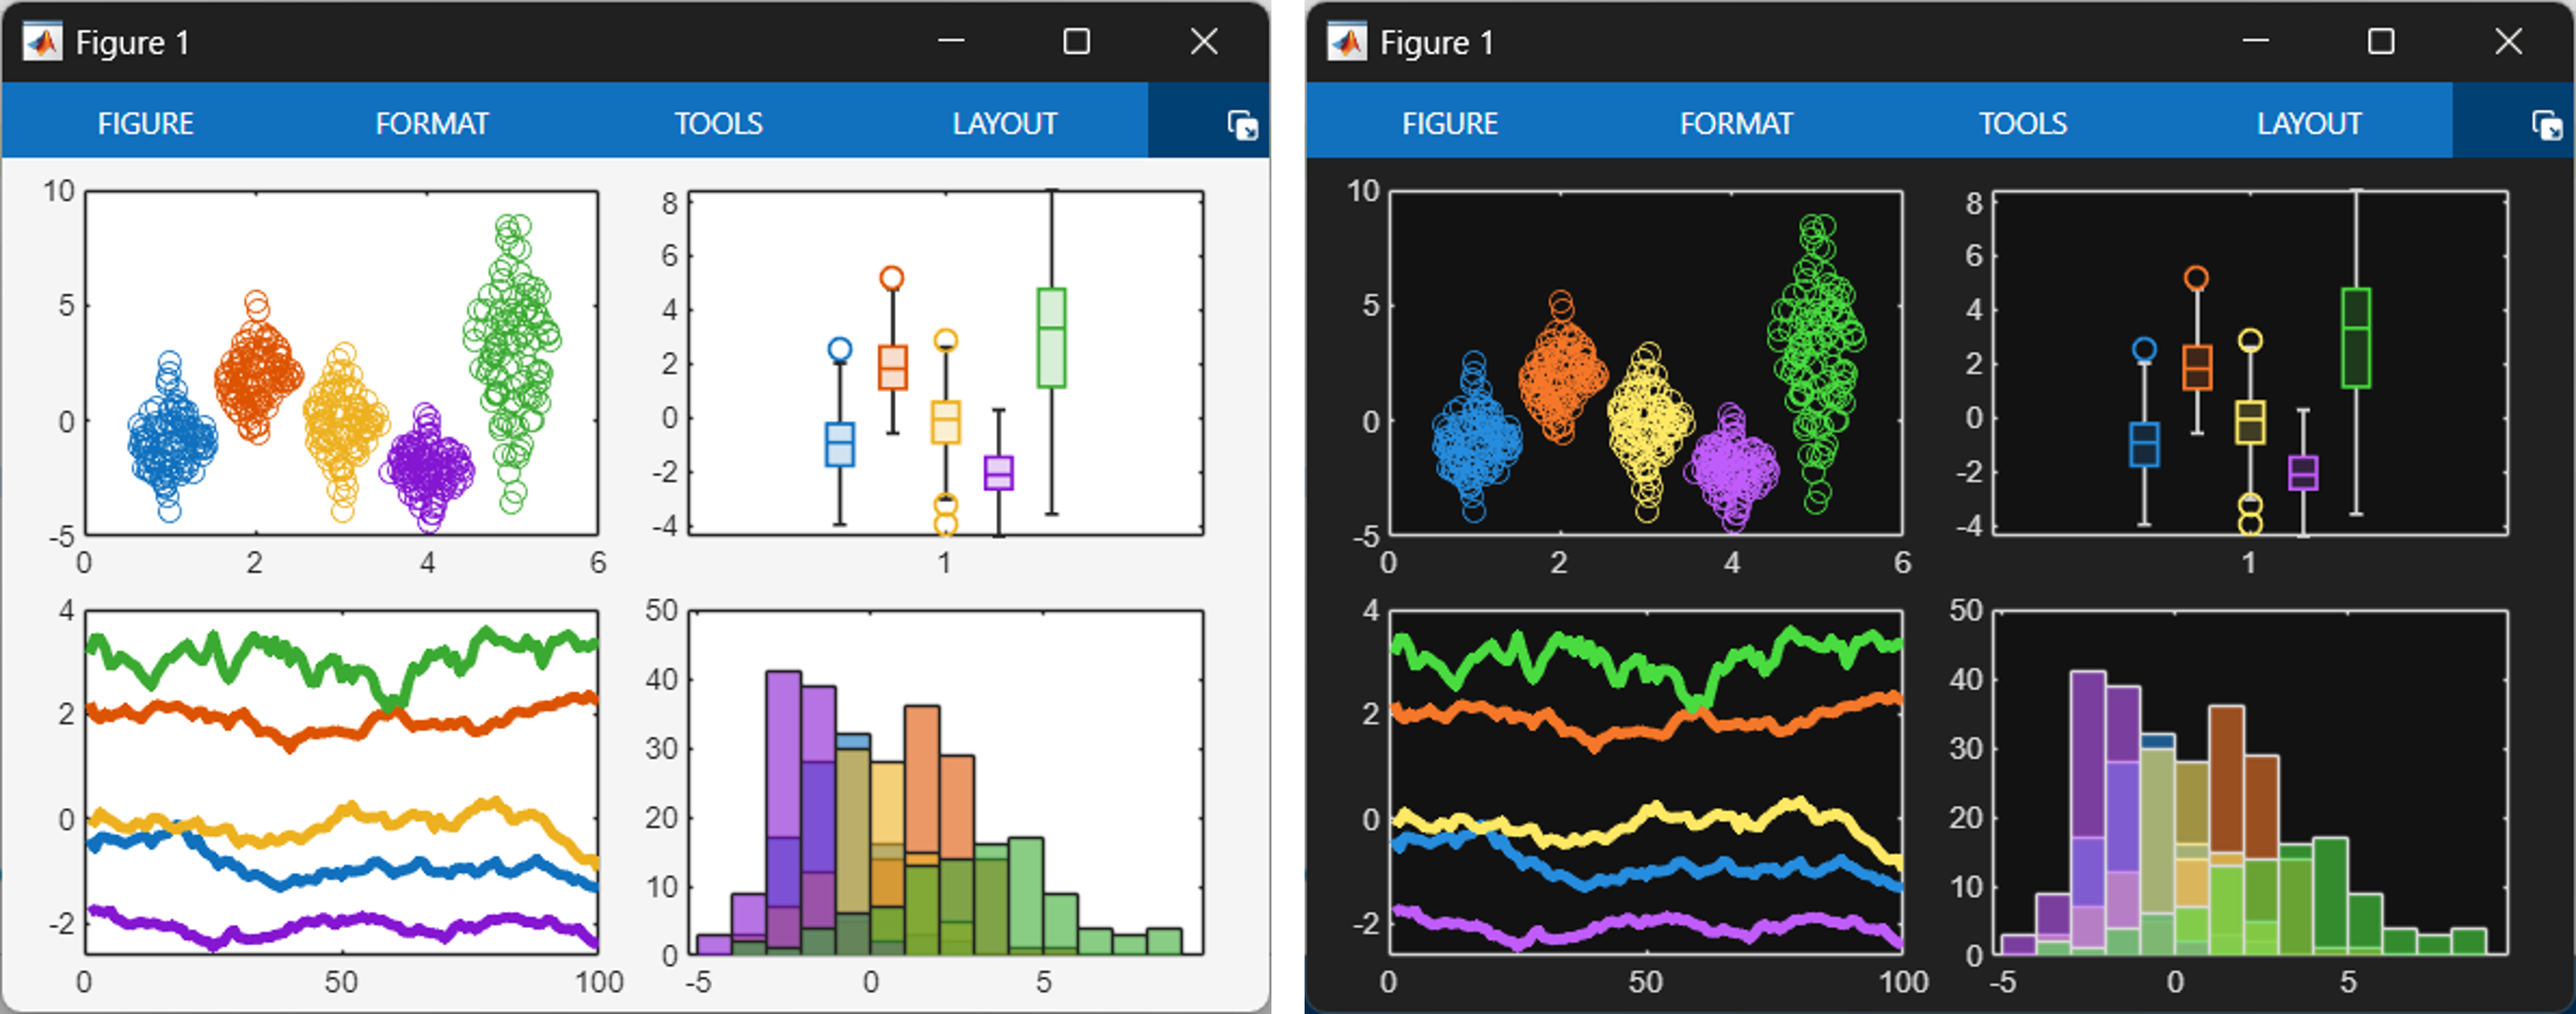
A Guide to Themes for Chart Creators and App Builders
The long-awaited dark theme is now available in MATLAB R2025a. This article serves as a guide for designing charts and...
3 mois il y a
Is there such a thing as MATLAB Markdown
In addition to recommendations to use a Live Script, starting in R2025a the MATLAB editor supports Markdown notation in addition...
4 mois il y a | 2
How to set figure size in 2025a
Thanks for mentioning this. It's being looked into. In the meantime, exportgraphics and copygraphics have new (R2025a) prope...
4 mois il y a | 0
How to create an embedded progress bar in app designer, Matlab R2019a?
Here's a step by step guide to creating an embedded progress bar https://www.mathworks.com/matlabcentral/answers/750314-progres...
4 mois il y a | 0
fill area between two polar curves
@Star Strider asked, "Note to MathWorks: Can we have a patch for polar coordinate systems when you have time to implement it?" ...
4 mois il y a | 1
Changing GUI figure icon
The Icon property has been available in a uifigure since since R2020b and it became available in regular figures in R2025a. f...
4 mois il y a | 1
Matlab mlapp gui auto minimises once folder selected using uigetdir() command is there any way to resotre main gui once folder selection done.
This has been fixed in R2025a. Focus now returns to the app that called uigetdir after the dialog is closed. The fix is also av...
4 mois il y a | 0
How do I control where focus goes after uigetfile dialog is dismissed
This has been fixed in R2025a. Focus now returns to the app that called uigetfile or uisetcolor after the dialog is closed. The...
4 mois il y a | 0
Uigetfile will make app be behind another windows.
Thanks for reporting the problem. This has been fixed in R2025a. Focus now returns to the app that called uigetfile after t...
4 mois il y a | 0
Publié le
Dark Theme for Plots and Apps
Guest Writer: Abby Skofield We're excited to welcome Abby Skofield back to the blog! Abby has been at the forefront of...
4 mois il y a

Publié le
Designing the New Figure Toolstrip Around User Experience
Guest Writer: Travis Roderick Travis joined MathWorks in 2013, bringing experience from previous roles in software...
4 mois il y a

Publié le
Introducing the Tabbed Figure Container
Guest Writer: Brian Knolhoff Brian is a software engineer on the Figure Infrastructure and Services team at MathWorks....
4 mois il y a

Change color of binscatter plot
binscatter uses a colormap to show densities. Setting binscatter to a single color would defeate the purpose of the function be...
4 mois il y a | 0
Colour background for polar axes
In MATLAB R2025a (and later), patch and surface objects are supported in polaraxes; so is dark theme. R2025a pax = polaraxes...
4 mois il y a | 0
Cannot close figure using CloseFunctionRequest
The CloseRequestFcn defines what to do when someone tries to close the figure. If you override the CloseRequestFcn then instead...
5 mois il y a | 0
| A accepté
sprintf vs. compose performance for large arrays on macOS
The execution below shows very different results than what's reported in the question. Note that I did some refactoring as to n...
5 mois il y a | 1
Dynamic filepath for sftp not allowed
The question is refering to the dir function for SFTP or FTP servers. https://www.mathworks.com/help/matlab/ref/matlab.io.sftp...
5 mois il y a | 1
| A accepté
Monitor Gamma Calibration (manual and grayscale)
I believe this describes your setup; please correct me if I'm wrong. You sent grayscale RGB values from MATLAB to your monito...
5 mois il y a | 0
| A accepté
Plans for supporting "imageshow" in uifigures & app builder?
imageshow can already be used in uifigures and apps. imageshow must be parented to a Viewer object and the Viewer object can be...
5 mois il y a | 0
| A accepté
Highlighted
Want insider info on R2025a graphics and app building features?
The Graphics and App Building Blog just launched its first article on R2025a features, authored by Chris Portal, the director of...
5 mois il y a | 17
Plotting a vertical line using xline with a value
new_t_val is symbolic. As the error message indicates, xline expects to recieve numeric, datetime, categorical, or duration val...
5 mois il y a | 0
| A accepté
Publié le
Introducing the New Graphics and App Building System in MATLAB R2025a
Guest Writer: Chris Portal Chris Portal serves as director of engineering for the MATLAB graphics and app building teams,...
5 mois il y a