bubblesize
Set minimum and maximum bubble sizes in points
Description
bubblesize( sets the size of the
smallest and largest bubble for bubble charts in the current axes. Specify
sizerange)sizerange as a two-element vector containing the smallest and largest
diameters in points, where 1 point = 1/72 inch.
sz = bubblesize returns the size range for the current axes as a
two-element vector containing the diameters of the smallest and largest bubbles in
points.
Examples
Create a bubble chart with a legend.
x = 1:10;
y = [4 7 10 7 3 6 5 1 9 7];
sz = [5 1 14 6 9 12 15 20 8 2];
bubblechart(x,y,sz);
bubblelegend('Population','Location','northeastoutside')
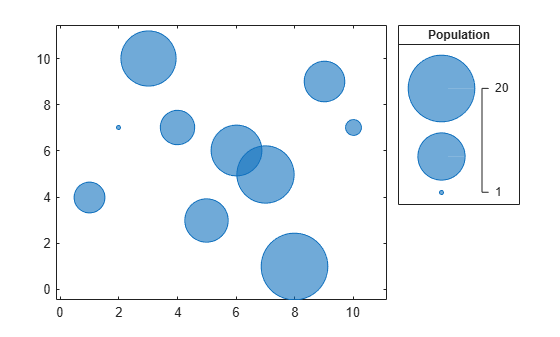
Get the current range of bubble sizes.
bubblesize
ans = 1×2

     3    50
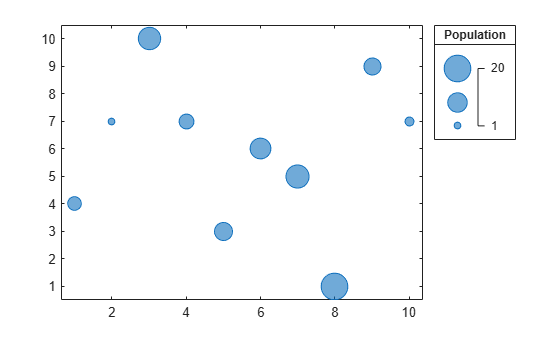
Change the bubble sizes so that they are between 5 and 20 points in diameter. The bubble legend automatically updates to reflect the new bubble sizes.
bubblesize([5 20])
Create two sets of data, then create a tiled chart layout containing two bubble charts.
% Create two sets of data
x1 = 1:10;
x2 = 1:50;
y1 = rand(1,10);
y2 = rand(1,50);
sz1 = randperm(10,10);
sz2 = randperm(50,50);

% Create tiled chart layout
t = tiledlayout(1,2);

% Create bubble chart in first tile
ax1 = nexttile;
bubblechart(x1,y1,sz1)

% Create bubble chart in first tile
ax2 = nexttile;
bubblechart(x2,y2,sz2)
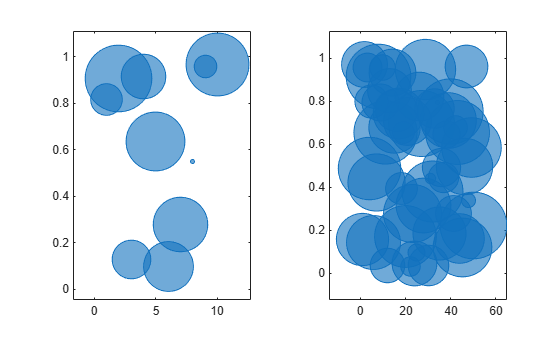
Query the range of bubble sizes in the right chart by passing ax2 to the bubblesize function.
bubblesize(ax2)
ans = 1×2

     3    50
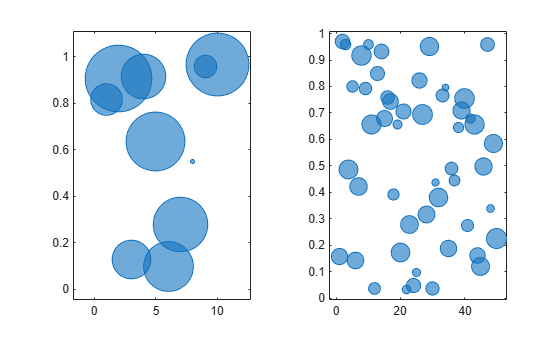
Change the bubble sizes in the right chart so that they range between 5 and 15 points in diameter.
bubblesize(ax2,[5 15])
Input Arguments
Version History
Introduced in R2020b