Main Content

pmusic

Pseudospectrum using MUSIC algorithm

Description

example

[S,wo] = pmusic(x,p) implements the multiple signal classification (MUSIC) algorithm and returns S, the pseudospectrum estimate of the input signal x, and a vector wo of normalized frequencies (in rad/sample) at which the pseudospectrum is evaluated. You can specify the signal subspace dimension using the input argument p.

[S,wo] = pmusic(x,p,wi) returns the pseudospectrum computed at the normalized frequencies specified in vector wi. The vector wi must have two or more elements, because otherwise the function interprets it as nfft.

[S,wo] = pmusic(___,nfft) specifies the integer length of the FFT, nfft, used to estimate the pseudospectrum. This syntax can include any combination of input arguments from previous syntaxes.

example

[S,wo] = pmusic(___,'corr') forces the input argument x to be interpreted as a correlation matrix rather than matrix of signal data. For this syntax, x must be a square matrix, and all of its eigenvalues must be nonnegative.

example

[S,fo] = pmusic(x,p,nfft,fs) returns the pseudospectrum computed at the frequencies specified in vector fo (in Hz). Supply the sample rate fs in Hz.

[S,fo] = pmusic(x,p,fi,fs) returns the pseudospectrum computed at the frequencies specified in the vector fi. The vector fi must have two or more elements, because otherwise the function interprets it as nfft.

example

[S,fo] = pmusic(x,p,nfft,fs,nwin,noverlap) returns the pseudospectrum S by segmenting the input data x using the window nwin and overlap length noverlap.

[___] = pmusic(___,freqrange) specifies the range of frequency values to include in fo or wo.

[___,v,e] = pmusic(___) returns the matrix v of noise eigenvectors along with the associated eigenvalues in the vector e.

example

pmusic(___) with no output arguments plots the pseudospectrum in the current figure window.

Examples

collapse all

This example analyzes a signal vector, x, assuming that two real sinusoidal components are present in the signal subspace. In this case, the dimension of the signal subspace is 4, because each real sinusoid is the sum of two complex exponentials.

n = 0:199;
x = cos(0.257*pi*n) + sin(0.2*pi*n) + 0.01*randn(size(n));
pmusic(x,4)      % Set p to 4 because there are two real inputs

Figure contains an axes object. The axes object with title Pseudospectrum Estimate via MUSIC, xlabel Normalized Frequency ( times pi blank rad/sample), ylabel Power (dB) contains an object of type line.

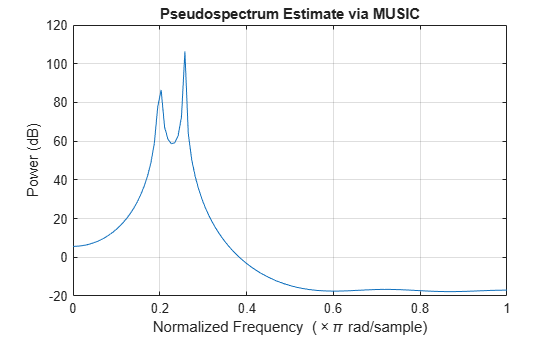
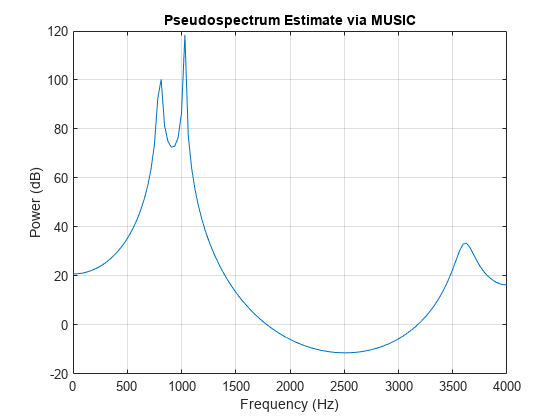
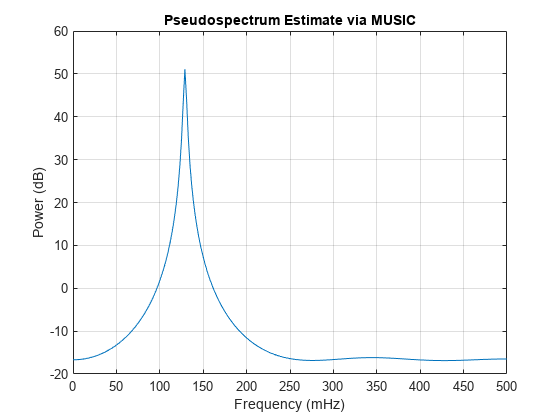
This example analyzes the same signal vector, x, with an eigenvalue cutoff of 10% above the minimum. Setting p(1) = Inf forces the signal/noise subspace decision to be based on the threshold parameter, p(2). Specify the eigenvectors of length 7 using the nwin argument, and set the sampling frequency, fs, to 8 kHz:

rng default
n = 0:199;
x = cos(0.257*pi*n) + sin(0.2*pi*n) + 0.01*randn(size(n));
[P,f] = pmusic(x,[Inf,1.1],[],8000,7); % Window length = 7
plot(f,20*log10(abs(P)))
xlabel 'Frequency (Hz)', ylabel 'Power (dB)'
title 'Pseudospectrum Estimate via MUSIC', grid on

Figure contains an axes object. The axes object with title Pseudospectrum Estimate via MUSIC, xlabel Frequency (Hz), ylabel Power (dB) contains an object of type line.

Supply a positive definite correlation matrix, R, for estimating the spectral density. Use the default 256 samples.

R = toeplitz(cos(0.1*pi*(0:6))) + 0.1*eye(7);
pmusic(R,4,'corr')

Figure contains an axes object. The axes object with title Pseudospectrum Estimate via MUSIC, xlabel Normalized Frequency ( times pi blank rad/sample), ylabel Power (dB) contains an object of type line.

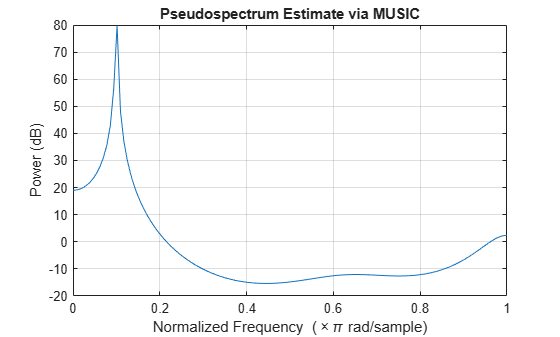
Enter a signal data matrix, Xm, generated from data using corrmtx.

n = 0:699;
x = cos(0.257*pi*(n)) + 0.1*randn(size(n));
Xm = corrmtx(x,7,'modified');
pmusic(Xm,2)

Figure contains an axes object. The axes object with title Pseudospectrum Estimate via MUSIC, xlabel Normalized Frequency ( times pi blank rad/sample), ylabel Power (dB) contains an object of type line.

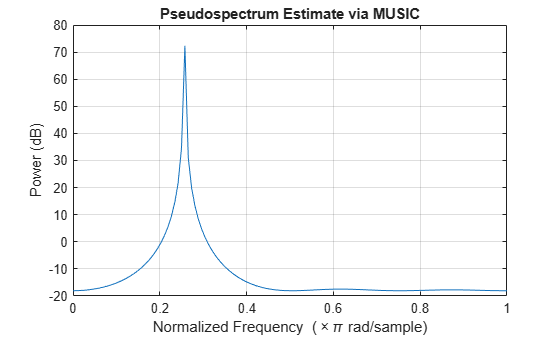
Use the same signal, but let pmusic form the 100-by-7 data matrix using its windowing input arguments. In addition, specify an FFT of length 512.

n = 0:699;
x = cos(0.257*pi*(n)) + 0.1*randn(size(n));
[PP,ff] = pmusic(x,2,512,[],7,0);
pmusic(x,2,512,[],7,0)

Figure contains an axes object. The axes object with title Pseudospectrum Estimate via MUSIC, xlabel Frequency (mHz), ylabel Power (dB) contains an object of type line.

Input Arguments

collapse all

Input signal, specified as a vector or matrix. If x is a vector, then it is treated as one observation of the signal. If x is a matrix, each row of x represents a separate observation of the signal. For example, each row is one output of an array of sensors, as in array processing, such that x'*x is an estimate of the correlation matrix.

Note

You can use the output of corrmtx to generate x.

Complex Number Support: Yes

Subspace dimension, specified as a real positive integer or a two-element vector. If p is a real positive integer, then it is treated as the subspace dimension. If p is a two-element vector, the second element of p represents a threshold that is multiplied by λmin, the smallest estimated eigenvalue of the signal's correlation matrix. Eigenvalues below the threshold λmin*p(2) are assigned to the noise subspace. In this case, p(1) specifies the maximum dimension of the signal subspace. The extra threshold parameter in the second entry in p provides you more flexibility and control in assigning the noise and signal subspaces.

Note

If the inputs to pmusic are real sinusoids, set the value of p to two times the number of sinusoids. If the inputs are complex sinusoids, set p equal to the number of sinusoids.

Complex Number Support: Yes

Input normalized frequencies, specified as a vector.

Data Types: double

Number of DFT points, specified as a positive integer. If nfft is specified as empty, the default nfft is used.

Sample rate, specified as a positive scalar in Hz. in Hz. If you specify fs with the empty vector [], the sample rate defaults to 1 Hz.

Input frequencies, specified as a vector. The pseudospectrum is computed at the frequencies specified in the vector.

Length of rectangular window, specified as a nonnegative integer.

Number of overlapped samples, specified as a nonnegative integer smaller than the length of window.

Note

The arguments nwin and noverlap are ignored when you include 'corr' in the syntax.

Frequency range of pseudospectrum estimates,specified as one of 'half', whole, or 'centered'.

  • 'half' — Returns half the spectrum for a real input signal x. If nfft is even, then S has length nfft/2 + 1 and is computed over the interval [0, π]. If nfft is odd, the length of S is (nfft + 1)/2 and the frequency interval is [0,π). When your specify fs, the intervals are [0, fs/2) and [0, fs/2] for even and odd nfft, respectively.

  • 'whole' — Returns the whole spectrum for either real or complex input x. In this case, S has length nfft and is computed over the interval [0, 2π). When you specify fs, the frequency interval is [0, fs).

  • 'centered' — Returns the centered whole spectrum for either real or complex input x. In this case, S has length nfft and is computed over the interval (–π, π] for even nfft and (–π, π) for odd nfft. When you specify fs, the frequency intervals are (–fs/2, fs/2] and (–fs/2, fs/2) for even and odd nfft, respectively.

Note

You can put the arguments freqrange or 'corr' anywhere in the input argument list after p.

Output Arguments

collapse all

Pseudospectrum estimate, returned as a vector. The pseudospectrum is calculated using estimates of the eigenvectors of a correlation matrix associated with the input data x.

Output normalized frequencies, specified as a vector. S and wo have the same length. In general, the length of the FFT and the values of the input x determine the length of the computed S and the range of the corresponding normalized frequencies. The table indicates the length of S (and wo) and the range of the corresponding normalized frequencies for the first syntax.

S Characteristics for an FFT Length of 256 (Default)

Input Data TypeLength of S and w0Range of the Corresponding Normalized Frequencies

Real

129

[0, π]

Complex

256

[0, 2π)

If nfft is specified, the following table indicates the length of S and wo and the frequency range for wo.

S and Frequency Vector Characteristics

Input Data Typenfft Even or OddLength of S and wRange of w

Real

Even

(nfft/2 )+ 1

[0, π]

Real

Odd

(nfft + 1)/2

[0, π)

Complex

Even or odd

nfft

[0, 2π)

Output frequency, returned as a vector. The frequency range for fo depends on nfft, fs, and the values of the input x. The length of S (and fo) is the same as in the S and Frequency Vector Characteristics above. The following table indicates the frequency range for fo if nfft and fs are specified.

S and Frequency Vector Characteristics with fs Specified

Input Data Type

nfft Even/Odd

Range of f

Real

Even

[0, fs/2]

Real

Odd

[0, fs/2)

Complex

Even or odd

[0, fs)

Additionally, if nwin and noverlap are also specified, the input data x is segmented and windowed before the matrix used to estimate the correlation matrix eigenvalues is formulated. The segmentation of the data depends on nwin, noverlap, and the form of x. Comments on the resulting windowed segments are described in the following table.

Windowed Data Depending on x and nwin 

form of x

Form of nwin

Windowed Data

Data vector

Scalar

Length is nwin.

Data vector

Vector of coefficients

Length is length(nwin).

Data matrix

Scalar

Data is not windowed.

Data matrix

Vector of coefficients

length(nwin) must be the same as the column length of x, and noverlap is not used.

See the Eigenvector Length Depending on Input Data and Syntax for related information on this syntax.

Noise eigenvectors, returned as a matrix. The columns of v span the noise subspace of dimension size(v,2). The dimension of the signal subspace is size(v,1)-size(v,2).

Estimated eigenvalues of the correlation matrix, returned as a vector.

Tips

In the process of estimating the pseudospectrum, pmusic computes the noise and signal subspaces from the estimated eigenvectors vj and eigenvalues λj of the signal's correlation matrix. The smallest of these eigenvalues is used in conjunction with the threshold parameter p(2) to affect the dimension of the noise subspace in some cases.

The length n of the eigenvectors computed by pmusic is the sum of the dimensions of the signal and noise subspaces. This eigenvector length depends on your input (signal data or correlation matrix) and the syntax you use.

The following table summarizes the dependency of the eigenvector length on the input argument.

Eigenvector Length Depending on Input Data and Syntax

Form of Input Data x

Comments on the Syntax

Length n of Eigenvectors

Row or column vector

nwin is specified as a scalar integer.

nwin

Row or column vector

nwin is specified as a vector.

length(nwin)

Row or column vector

nwin is not specified.

2 × p(1)

l-by-m matrix

If nwin is specified as a scalar, it is not used. If nwin is specified as a vector, length(nwin) must equal m.

m

m-by-m nonnegative definite matrix

'corr' is specified and nwin is not used.

m

You should specify nwin > p(1) or length(nwin) > p(1) if you want p(2) > 1 to have any effect.

Algorithms

The multiple signal classification (MUSIC) algorithm estimates the pseudospectrum from a signal or a correlation matrix using Schmidt's eigenspace analysis method [1]. The algorithm performs eigenspace analysis of the signal's correlation matrix to estimate the signal's frequency content. This algorithm is particularly suitable for signals that are the sum of sinusoids with additive white Gaussian noise. The eigenvalues and eigenvectors of the correlation matrix of the signal are estimated if you do not supply the correlation matrix.

The algorithm used to compute the MUSIC pseudospectrum estimate takes into account the relative sizes of the signal and noise subspaces.

  • If the dimension of the signal subspace is smaller than the dimension of the noise subspace, the MUSIC pseudospectrum estimate is given by

    PMUSIC(f)=1k=1p(1|vkHe(f)|2),

    where p is the dimension of the signal subspace and vk is the kth eigenvector of the correlation matrix. The eigenvectors used in the sum correspond to the largest eigenvalues and span the signal subspace.

  • If the dimension of the noise subspace is smaller than the dimension of the signal subspace, the MUSIC pseudospectrum estimate is given by

    PMUSIC(f)=1eH(f)(k=p+1NvkvkH)e(f)=1k=p+1N|vkHe(f)|2,

    where N is the dimension of the signal subspace plus the dimension of the noise subspace and vk is the kth eigenvector of the correlation matrix. The eigenvectors used in the sum correspond to the smallest eigenvalues and span the noise subspace.

In each case, the vector e(f) consists of complex exponentials, so the inner product vkHe(f) amounts to a Fourier transform. This is used for computation of the pseudospectrum estimate. The FFT is computed for each vk and then the squared magnitudes are summed.

References

[1] Marple, S. Lawrence. Digital Spectral Analysis. Englewood Cliffs, NJ: Prentice-Hall, 1987, pp. 373–378.

[2] Schmidt, R. O. “Multiple Emitter Location and Signal Parameter Estimation.” IEEE® Transactions on Antennas and Propagation. Vol. AP-34, March, 1986, pp. 276–280.

[3] Stoica, Petre, and Randolph L. Moses. Spectral Analysis of Signals. Upper Saddle River, NJ: Prentice Hall, 2005.

Extended Capabilities

Version History

Introduced before R2006a