Artifact Tracing
Units
A unit is a functional entity in your software architecture that you can execute and test independently or as part of larger system tests. Software development standards, such as ISO 26262-6, define objectives for unit testing. Unit tests typically must cover each of the requirements for the unit and must demonstrate traceability between the requirements, the tests, and the unit. Unit tests must also meet certain coverage objectives for the unit, such as modified condition/decision coverage (MC/DC).
By default, the dashboard analyzes all models inside your project folder and considers Simulink® models as units.
You can use a trace view to see the units and components in your project. For more information, see Explore Traceability Information Using Trace Views. If you want to exclude certain models from the dashboard, specify which models are units or components by labeling them in your project and configuring the dashboard to recognize the label, as shown in Specify Models as Components and Units.
Components
A component is an entity that integrates multiple testable units together.
By default, the dashboard analyzes all models inside your project folder and considers System Composer™ architecture models as components. Supported architectures include System Composer architecture models, System Composer software architecture models, and AUTOSAR architectures.
You can use a trace view to see the units and components in your project. For more information, see Explore Traceability Information Using Trace Views. If you want to exclude certain models from the dashboard, specify which models are units or components by labeling them in your project and configuring the dashboard to recognize the label, as shown in Specify Models as Components and Units.
Specify Models as Components and Units
You can control which models appear as units and components by labeling them in your project and configuring the dashboard to recognize the labels.
Open a project. For this example, in the MATLAB® Command Window, enter:
This example project already has component and unit models configured.openExample("slcheck/ExploreTestingMetricDataInModelTestingDashboardExample"); openProject("cc_CruiseControl");
Create a project label category that will contain your testing architecture labels. On the Project tab, in the Environment section, click Settings. Then, in the Labels section, click New Category. Type a name for the category, for example,
Testing Interfaceand then click OK.Create a label for the units. Click the category that you created and select New Label. Enter the label name
Software Unit.Create a label for the components. Click the category that you created and select New Label. Enter the label name
Software Component.Close the Project Settings dialog box by clicking OK.
For more information on how to create project label categories and labels, see Create and Manage Labels.
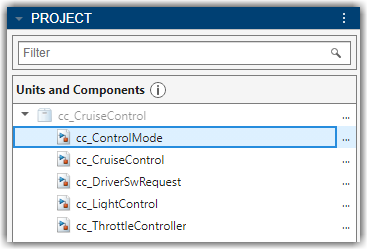
Label the models in the project as components and units. In the project pane, right-click a model, click Add Label and choose the category and label. For this example, in the
modelsfolder, apply these labels to these models:cc_CruiseControl— Testing Interface > Software Componentcc_ControlMode— Testing Interface > Software Unitcc_DriverSwRequest— Testing Interface > Software Unitcc_LightControl— Testing Interface > Software Unitcc_TargetSpeedThrottle— Testing Interface > Software Unit
For more information on how to add project labels, see Add Labels to Project Files.
Open the Dashboard window by using one of these approaches:
On the Project tab, in the Tools section, click Model Testing Dashboard.
On the Project tab, in the Tools section, click Model Design Dashboard.
In the Dashboard tab, click Options.
In the Project Options dialog box, in the Classification section, specify the category and labels that you created for the components and units. For the component interface, set Category to
Testing Interfaceand Label toSoftware Component. For the unit interface, set Category toTesting Interfaceand Label toSoftware Unit.
Click Apply. The dashboard updates the list of artifacts in the Project panel.
To open a dashboard for a unit or component, click the name of the unit or component in the Project panel. The dashboard shows the metric results for the unit or component you select.
Trace Artifacts to Units and Components
The Project panel displays artifacts from the current project that are compatible with the currently selected dashboard. For example, you can open the Model Testing Dashboard for a unit in your project and you can open the Model Maintainability Dashboard for a unit or component in your project. You can specify which entities in your software architecture are units or higher-level components by labeling them in your project and configuring the dashboard to recognize the labels. By default, if you do not specify the models that are considered components, then the dashboard considers:
Simulink models as units.
System Composer architecture models as components.
For more information, see Categorize Models in Hierarchy as Components or Units.
To determine which artifacts are in the scope of a unit or component, the dashboard analyzes the traceability links between the artifacts, software unit models, and component models in the project. By default, the dashboard analyzes all files inside your project folder, even if the files are not on the path or not added to the project. If you want to exclude certain models from the dashboard, specify which models are units or components by labeling them in your project and configuring the dashboard to recognize the label, as shown in Specify Models as Components and Units.
To see the traceability path that the dashboard found between a unit or component and its artifacts, open a trace view by clicking the Traceability tab and selecting a trace view from the Add Trace View section of the toolstrip. Trace views are interactive diagrams that you can use to see how artifacts trace to units and components in your design and to view the traceability information for requirements, tests, and test results in the project. For more information, see Explore Traceability Information Using Trace Views.
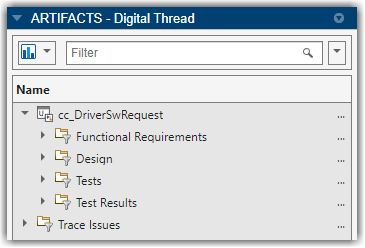
When you select an artifact in the Project panel, the Artifacts panel shows the artifacts that trace to the selected artifact. For units and components, the traced artifacts include:
Functional requirements
Design artifacts
Tests
Test results
Functional Requirements
The folder Functional Requirements shows requirements of
Type
Functional that are either implemented by or upstream of the unit or
component.
When you collect metric results, the dashboard analyzes only the functional requirements that the unit or component directly implements. The folder Functional Requirements contains two subfolders to help identify which requirements are implemented by the unit or component, or are upstream of the unit or component:
Implemented — Functional requirements that are directly linked to the unit or component with a link Type of
Implements. The dashboard uses these requirements in the metrics for the unit or component.Upstream — Functional requirements that are indirectly or transitively linked to the implemented requirements. The dashboard does not use these requirements in the metrics for the unit or component.
Use the Requirements Toolbox™ to create or import the requirements in a requirements file
(.slreqx). If a requirement does not trace to a unit or
component, it appears in the Trace Issues folder. If a
requirement does not appear in the Artifacts panel when you expect
it to, see Resolve Missing Artifacts, Links, and Results.
For more information on how the dashboard traces dependencies between project files, see Monitor Artifact Traceability and Detect Outdated Results with Digital Thread.
Design Artifacts
The folder Design shows project artifacts that trace to the current unit or component, including:
The model file that contains the block diagram for the unit or component.
Models that the unit or component references.
Libraries that are partially or fully used by the model.
Data dictionaries that are linked to the model.
External MATLAB code that traces to the model.
If an artifact does not appear in the Design folder when you expect it to, see Resolve Missing Artifacts, Links, and Results. For more information on how the dashboard traces dependencies between project files, see Monitor Artifact Traceability and Detect Outdated Results with Digital Thread.
Note
If you expect external MATLAB code to appear in the dashboard and it does not, check if the construct is not supported:
A class method does not appear in the Artifacts panel if the method is:
A nonstatic method that you call using dot notation.
A nonstatic method that you call using function notation.
A static method that you call from a Simulink model using dot notation.
A superclass method.
Defined in a separate file from the class definition file.
For these methods, the dashboard shows the associated class definition in the Design folder.
A class constructor does not appear in the Artifacts panel if the constructor is a superclass constructor. The dashboard shows the associated superclass definition in the Design folder, but not the method itself.
A class property does not appear in the Artifacts panel if the property is called from Simulink or Stateflow®. The dashboard shows the associated class definition in the Artifacts panel.
An enumeration class does not appear in the Artifacts panel. For example, if you use an Enumerated Constant block in Simulink, the dashboard does not show the MATLAB class that defines the
enumtype.If a class file contains a method and a local function that have the same name, calls that use dot notation call the method in the class definition, and calls that use function notation call the local function in the class file.
Tests
The folder Tests shows tests and test harnesses that trace to the selected unit. A test can be either a test iteration or a test case without iterations.
When you collect metric results for a unit, the dashboard analyzes only the unit tests. The folder Tests contains subfolders to help identify whether a test is considered a unit test and which test harnesses trace to the unit:
Unit Tests — Tests that the dashboard considers as unit tests. A unit test directly tests either the entire unit or lower-level elements in the unit, like subsystems. The dashboard uses these tests in the metrics for the unit.
Others — Tests that trace to the unit but that the dashboard does not consider as unit tests. For example, the dashboard does not consider tests on a library, subsystem reference, or virtual subsystem to be unit tests. The dashboard does not use these tests in the metrics for the unit.
Test Harnesses — Test harnesses that trace to the unit or lower-level elements in the unit. Double-click a test harness to open it.
Create tests by using Simulink Test™. If a test does not trace to a unit, it appears in the Trace Issues folder. If a test does not appear in the Artifacts panel or you do not see metric results from a test when you expect to, see Resolve Missing Artifacts, Links, and Results.
For more information on how the dashboard traces dependencies between project files, see Monitor Artifact Traceability and Detect Outdated Results with Digital Thread.
Test Results
When you collect metric results for a unit, the dashboard analyzes only the test results from unit tests. The folder Test Results contains subfolders to help identify which test results are from unit tests.
The subfolders for Model, SIL, and PIL contain simulation results from normal, software-in-the-loop (SIL), and processor-in-the-loop (PIL) unit tests, respectively. The dashboard uses these results in the metrics for the unit.
The following types of test results are shown:
 Saved test results — results that
you have collected in the Test Manager and have exported to a
results file.
Saved test results — results that
you have collected in the Test Manager and have exported to a
results file. Temporary test results — results
that you have collected in the Test Manager but have not exported to
a results file. When you export the results from the Test Manager
the dashboard analyzes the saved results instead of the temporary
results. Additionally, the dashboard stops recognizing the temporary
results when you close the project or close the result set in the
Simulink Test Result Explorer. If you want to analyze the results in
a subsequent test session or project session, export the results to
a results file.
Temporary test results — results
that you have collected in the Test Manager but have not exported to
a results file. When you export the results from the Test Manager
the dashboard analyzes the saved results instead of the temporary
results. Additionally, the dashboard stops recognizing the temporary
results when you close the project or close the result set in the
Simulink Test Result Explorer. If you want to analyze the results in
a subsequent test session or project session, export the results to
a results file.
Others — Results that are not simulation results, are not from unit tests, are from disabled tests, or are only reports. The dashboard does not use these results in the metrics for the unit.
If a test result does not trace to a unit, it appears in the Trace Issues folder. If a test result does not appear in the Artifacts panel or you do not see metric results from a test when you expect to, see Resolve Missing Artifacts, Links, and Results.
If you use external MATLAB functions, see Control Inlining for External MATLAB Functions. The inlining of functions can produce inconsistent coverage metric results in the dashboard.
For more information on how the dashboard traces dependencies between project files, see Monitor Artifact Traceability and Detect Outdated Results with Digital Thread.
Note
Note that the model coverage metrics do not scope coverage to requirements. If you select the Scope coverage results to linked requirements check box in your test results, the dashboard ignores that selection and does not scope the model coverage metrics results that appear in the dashboard. For information on the Scope coverage results to linked requirements option, see Scoping Coverage for Requirements-Based Tests (Simulink Test).
Trace Issues
The folder Trace Issues shows artifacts that the dashboard has not traced to units or components. Use the folder Trace Issues to check if artifacts are missing traceability to the units or components. The folder Trace Issues contains subfolders to help identify the type of tracing issue:
Unexpected Implementation Links — Requirement links of Type
Implementsfor a requirement of TypeContaineror TypeInformational. The dashboard does not expect these links to be of TypeImplementsbecause container requirements and informational requirements do not contribute to the Implementation and Verification status of the requirement set that they are in. If a requirement is not meant to be implemented, you can change the link type. For example, you can change a requirement of TypeInformationalto have a link of TypeRelated to.Unresolved and Unsupported Links — Requirements links that are either broken in the project or not supported by the dashboard. For example, if a model block implements a requirement, but you delete the model block, the requirement link is now unresolved. The dashboard does not support traceability analysis for some artifacts and some links.
Untraced Tests — Tests that execute on models or lower-level elements, like subsystems, that are not on the project path.
Untraced Results — Results that the dashboard cannot trace to a test. For example, if a test produces a result, but you delete the test, the dashboard cannot trace the results to the test.
The dashboard does not support traceability analysis for some artifacts and some links. If an artifact is untraced when you expect it to trace to a unit or component, see the troubleshooting solutions in Resolve Missing Artifacts, Links, and Results.
Artifact Issues
To see details about artifacts that cause errors, warnings, and informational messages during analysis, click the Traceability tab and click Artifact Issues in the toolstrip. The issues persist between MATLAB sessions and you can sort the messages by their severity, message, source, or message ID.
The messages show:
Modeling constructs that the dashboard does not support
Links that the dashboard does not trace
Test harnesses or cases that the dashboard does not support
Test results missing coverage or simulation results
Artifacts that return errors when the dashboard loads them
Information about model callbacks that the dashboard deactivates
Artifacts that are not on the path and are not considered during tracing
For more information, see View Artifact Issues in Project.
Artifact Errors
The folder Errors appears if artifacts returned errors when the dashboard performed artifact analysis. These are some errors that artifacts might return during traceability analysis:
An artifact returns an error if it has unsaved changes when traceability analysis starts.
A test results file returns an error if it was saved in a previous version of Simulink.
To see details about the warnings and errors that the dashboard finds during artifact analysis, click the Traceability tab and click Artifact Issues in the toolstrip. Open these artifacts and fix the errors. The dashboard shows a banner at the top of the dashboard to indicate that the artifact traceability shown in the Project and Artifacts panels is outdated. Click the Trace Artifacts button on the banner to refresh the data in the Project and Artifacts panels.
Diagnostics
If you have errors or warnings during metric collection, the Diagnostics panel in the dashboard shows diagnostic messages that can help you identify and resolve these issues. You can filter the diagnostic messages by type, and you can clear the messages from the viewer.
If you expect an artifact to contribute to the metric results and it does not, make sure to check the Trace Issues folder in the Artifacts panel. The Trace Issues folder and subfolders show artifacts that the dashboard is unable to trace to the current artifact. Only artifacts that trace to the current artifact can contribute to the metric results in the dashboard. For more information on artifact traceability, see Resolve Missing Artifacts, Links, and Results.