La traduction de cette page n'est pas à jour. Cliquez ici pour voir la dernière version en anglais.
Chart
Implémenter une logique de contrôle avec une machine à états finis
Bibliothèques :
Stateflow
Description
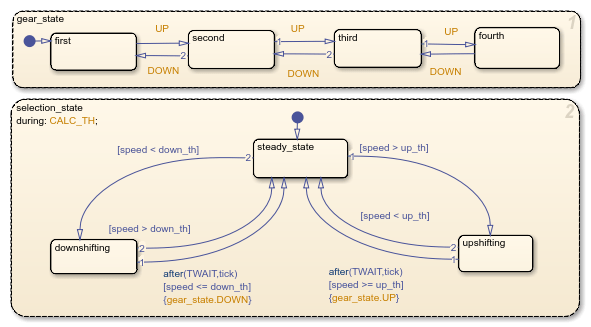
Le bloc Chart représente sous forme graphique une machine à états finis. Dans un diagramme Stateflow®, les états et les transitions constituent les blocs de base élémentaires d’un système de logique modale séquentielle. Les états correspondent aux modes de fonctionnement et les transitions représentent le passage du système d'un mode de fonctionnement à un autre. Pour plus d’informations, veuillez consulter Model a Finite State Machine.
Pour implémenter une logique de contrôle, les diagrammes Stateflow peuvent utiliser MATLAB® ou C comme langage d’action. Pour plus d’informations, veuillez consulter Differences Between MATLAB and C as Action Language Syntax.
Exemples
Simplifier les diagrammes Stateflow en incorporant la sortie de l’état actif
Cet exemple montre la manière dont les données d’état actif peuvent simplifier le design de certains diagrammes Stateflow®, car vous n’avez pas besoin de maintenir des données fortement corrélées à la hiérarchie du diagramme. Lorsque vous activez les données d’état actif, Stateflow rapporte l’activité de l’état via un port de sortie vers Simulink® ou sous forme de données locales dans votre diagramme. Cet exemple indique comment simplifier le design d’un diagramme Stateflow en ajoutant des données de sortie de l’état actif. Pour plus d’informations, veuillez consulter Monitor State Activity Through Active State Data.

Model a Fitness Tracker
Implement a fitness tracker by using temporal logic and messages.
Ports
Entrée
Lorsque vous créez des données d'entrée dans le diagramme Stateflow au moyen du volet Symbols, Stateflow crée un port d’entrée correspondant sur le bloc Chart.
Types de données : single | double | int8 | int16 | int32 | int64 | uint8 | uint16 | uint32 | uint64 | Boolean | fixed point | enumerated | bus | string
Sortie
Lorsque vous créez des données de sortie dans le diagramme Stateflow au moyen du volet Symbols, Stateflow crée un port de sortie correspondant sur le bloc Chart.
Types de données : single | double | int8 | int16 | int32 | int64 | uint8 | uint16 | uint32 | uint64 | Boolean | fixed point | enumerated | bus | string
Paramètres
Pour modifier les paramètres de bloc de manière interactive, utilisez le Property Inspector. À partir de la barre d’outils Simulink®, dans l’onglet Simulation, dans la galerie Prepare, sélectionnez Property Inspector.
Remarque
Les diagrammes comportent également des paramètres de bloc Subsystem (Simulink) auxquels vous pouvez accéder en cliquant avec le bouton droit de la souris lorsque vous êtes sur le diagramme, et en cliquant sur Block Parameters (Subsystem). Toutefois, il est déconseillé de mettre à jour ces paramètres.
Méthode de mise à jour ou d’activation d’un diagramme Stateflow, spécifiée en tant que Inherited, Discrete ou Continuous.
InheritedL’entrée issue du modèle Simulink détermine le moment où le diagramme s’active au cours d'une simulation.
Si vous définissez des événements d'entrée pour le diagramme, le signal issu du bloc Simulink connecté au port de déclenchement, déclenche le diagramme. Le signal Simulink peut être
Rising,FallingouEither(montant et descendant), ou en réponse à unFunction Call. Pour plus d’informations, veuillez consulter Activer un diagramme Stateflow en envoyant des événements en entrée.Si vous ne définissez pas d'événements d'entrée, le diagramme Stateflow hérite implicitement des déclencheurs du modèle Simulink. Ces événements implicites sont les pas d'échantillonnage discrets ou continus des signaux Simulink qui fournissent des entrées au diagramme. Si vous définissez des entrées de données, le diagramme s’active à la vitesse d'entrée de données la plus rapide. Si vous ne définissez pas d'entrée de données pour le diagramme, celui-ci s’active en fonction du comportement d'exécution de son sous-système parent.
DiscreteLe diagramme Stateflow s’active lorsque le modèle Simulink génère un événement implicite à des intervalles de temps réguliers que vous spécifiez dans la propriété Sample Time du diagramme. Les autres blocs du modèle Simulink peuvent présenter différents pas d’échantillonnage.
ContinuousLe diagramme Stateflow met à jour son état uniquement pendant les pas de temps majeurs. Il calcule les sorties et variables continues locales pendant les pas de temps majeurs et mineurs. Le diagramme peut enregistrer des passages par zéro, ce qui permet aux modèles Simulink d'échantillonner les diagrammes Stateflow chaque fois qu'un changement d'état se produit. Le diagramme Stateflow calcule les dérivées pour les variables continues locales. Pour plus d’informations, veuillez consulter Continuous-Time Modeling in Stateflow.
Utilisation programmatique
Pour définir la valeur du paramètre du diagramme de manière programmatique, accédez à l'objet Stateflow.Chart du diagramme et modifiez la propriété de l'objet au moyen de la notation par points.
| Paramètre : | ChartUpdate |
| Valeurs : | "INHERITED" (par défaut) | "CONTINUOUS" | "DISCRETE" |
Spécifiez l’intervalle de temps pendant lequel le diagramme s’active pendant la simulation. La valeur par défaut indique que le diagramme hérite du pas d'échantillonnage de Simulink. Pour plus d’informations sur la spécification du pas d’échantillonnage, veuillez consulter Spécifier les pas d'échantillonnage (Simulink).
N‘utilisez pas le paramètre Sample Time dans les paramètres du bloc Subsystem. Utilisez à la place le Property Inspector.
Dépendances
Pour activer ce paramètre, définissez Update method sur Discrete.
Utilisation programmatique
Pour définir la valeur du paramètre du diagramme de manière programmatique, accédez à l'objet Stateflow.Chart du diagramme et modifiez la propriété de l'objet au moyen de la notation par points.
| Paramètre : | SampleTime |
| Valeurs : | "-1" (par défaut) | string scalar | character vector |
| Types de données : | string | char |
Activation ou non de la détection du passage par zéro lors des transitions d'état dans le diagramme. Pour plus d’informations, veuillez consulter Continuous-Time Modeling in Stateflow.
Dépendances
Pour activer ce paramètre, définissez Update method sur Continuous.
Utilisation programmatique
Pour définir la valeur du paramètre du diagramme de manière programmatique, accédez à l'objet Stateflow.Chart du diagramme et modifiez la propriété de l'objet au moyen de la notation par points.
| Paramètre : | EnableZeroCrossings |
| Valeurs : | true or 1 (par défaut) | false or 0 |
| Types de données : | logical |
Utilisation ou non d'opérations en bits dans les actions d'état et de transition du diagramme, spécifiée sous la forme d'un 1 (vrai) ou d'un 0 (faux), numérique ou logique.
Dépendances
Pour activer ce paramètre, définissez Action language sur C.
Utilisation programmatique
Pour définir la valeur du paramètre du diagramme de manière programmatique, accédez à l'objet Stateflow.Chart du diagramme et modifiez la propriété de l'objet au moyen de la notation par points.
| Paramètre : | EnableBitOps |
| Valeurs : | false or 0 (par défaut) | true or 1 |
| Types de données : | logical |
Création ou non d'un port de sortie de données d'état actif pour le diagramme. Pour plus d’informations, veuillez consulter Monitor State Activity Through Active State Data.
Dépendances
Pour activer ce paramètre, créez un état Stateflow, une table de transition d'état ou un sous-diagramme atomique.
Utilisation programmatique
Pour définir la valeur du paramètre du diagramme de manière programmatique, accédez à l'objet Stateflow.Chart du diagramme et modifiez la propriété de l'objet au moyen de la notation par points.
| Paramètre : | HasOutputData |
| Valeurs : | false or 0 (par défaut) | true or 1 |
| Types de données : | logical |
Mode de surveillance des données de la sortie de l’état actif. Pour plus d’informations, veuillez consulter Monitor State Activity Through Active State Data.
Dépendances
Pour activer ce paramètre, activez Create output for monitoring.
Utilisation programmatique
Pour définir la valeur du paramètre du diagramme de manière programmatique, accédez à l'objet Stateflow.Chart du diagramme et modifiez la propriété de l'objet au moyen de la notation par points.
| Paramètre : | OutputMonitoringMode |
| Valeurs : | "ChildActivity" (par défaut) | "LeafStateActivity" |
Nom de l’objet des données d’état actif pour la table de transition d’état.
Dépendances
Pour activer ce paramètre, activez Create output for monitoring.
Utilisation programmatique
Pour définir la valeur du paramètre du diagramme de manière programmatique, accédez à l'objet Stateflow.Chart du diagramme et modifiez la propriété de l'objet au moyen de la notation par points.
| Paramètre : | OutputPortName |
| Valeurs : | "ChartMode" (par défaut) | string scalar | character vector |
| Types de données : | string | char |
Nom de l’objet des données d’état actif pour la table de transition d’état.
Dépendances
Pour activer ce paramètre, activez Create output for monitoring.
Utilisation programmatique
Pour définir la valeur du paramètre du diagramme de manière programmatique, accédez à l'objet Stateflow.Chart du diagramme et modifiez la propriété de l'objet au moyen de la notation par points.
| Paramètre : | EnumTypeName |
| Valeurs : | "ChartModeType" (par défaut) | string scalar | character vector |
| Types de données : | string | char |
Définition manuelle ou non du type de données énumérées pour la sortie de données d’état actif. Pour plus d’informations, veuillez consulter Define State Activity Enumeration Type.
Dépendances
Pour activer ce paramètre, activez Create output for monitoring.
Utilisation programmatique
Pour définir la valeur du paramètre du diagramme de manière programmatique, accédez à l'objet Stateflow.Chart du diagramme et modifiez la propriété de l'objet au moyen de la notation par points.
| Paramètre : | DoNotAutogenerateEnum |
| Valeurs : | false or 0 (par défaut) | true or 1 |
| Types de données : | logical |
Avancé
Initialisation ou non de la configuration d'état du diagramme au temps zéro plutôt qu'au premier événement d'entrée. Pour plus d’informations, veuillez consulter Execution of a Chart at Initialization.
Utilisation programmatique
Pour définir la valeur du paramètre du diagramme de manière programmatique, accédez à l'objet Stateflow.Chart du diagramme et modifiez la propriété de l'objet au moyen de la notation par points.
| Paramètre : | ExecuteAtInitialization |
| Valeurs : | false or 0 (par défaut) | true or 1 |
| Types de données : | logical |
Saturation ou non des données du diagramme en cas de dépassement d‘entier. Lorsque vous effacez ce paramètre, les données du diagramme s'enroulent sur le dépassement d'entier. Pour plus d’informations, veuillez consulter Handle Integer and Enumeration Overflow for Chart Data.
Utilisation programmatique
Pour définir la valeur du paramètre du diagramme de manière programmatique, accédez à l'objet Stateflow.Chart du diagramme et modifiez la propriété de l'objet au moyen de la notation par points.
| Paramètre : | SaturateOnIntegerOverflow |
| Valeurs : | true or 1 (par défaut) | false or 0 |
| Types de données : | logical |
Initialisation ou non des données de sortie à chaque activation du diagramme.
Lorsque vous sélectionnez ce paramètre, le diagramme réinitialise ses valeurs de sortie à chaque fois qu'il s’active et pas uniquement au temps 0. Le diagramme réinitialise les valeurs de sortie chaque fois qu'un appel de fonction, un déclenchement de front ou un compte à rebours déclenche le diagramme. Si vous définissez une valeur initiale pour un objet de données de sortie, la sortie se réinitialise sur cette valeur. Sinon, la sortie se réinitialise sur zéro. Sélectionnez ce paramètre pour :
Veillez à ce que toutes les sorties soient définies dans chaque exécution de diagramme.
Empêchez le verrouillage des sorties. Autrement dit, bloquez les valeurs des sorties calculées lors d'exécutions précédentes.
Attribuez une valeur initiale significative à toutes les sorties du diagramme.
Pour plus d’informations, veuillez consulter Initial value.
Utilisation programmatique
Pour définir la valeur du paramètre du diagramme de manière programmatique, accédez à l'objet Stateflow.Chart du diagramme et modifiez la propriété de l'objet au moyen de la notation par points.
| Paramètre : | InitializeOutput |
| Valeurs : | true or 1 (par défaut) | false or 0 |
| Types de données : | logical |
Prise en charge ou non par le diagramme des données de taille variable. Pour plus d’informations, veuillez consulter Declare Variable-Size Data in Stateflow Charts.
Utilisation programmatique
Pour définir la valeur du paramètre du diagramme de manière programmatique, accédez à l'objet Stateflow.Chart du diagramme et modifiez la propriété de l'objet au moyen de la notation par points.
| Paramètre : | SupportVariableSizing |
| Valeurs : | true or 1 (par défaut) | false or 0 |
| Types de données : | logical |
Exportation ou non de fonctions au niveau du diagramme vers d’autres blocs du modèle Simulink. Pour plus d’informations, veuillez consulter Export Stateflow Functions for Reuse.
Dépendances
Pour activer ce paramètre, ajoutez une fonction à votre diagramme.
Utilisation programmatique
Pour définir la valeur du paramètre du diagramme de manière programmatique, accédez à l'objet Stateflow.Chart du diagramme et modifiez la propriété de l'objet au moyen de la notation par points.
| Paramètre : | ExportChartFunctions |
| Valeurs : | false or 0 (par défaut) | true or 1 |
| Types de données : | logical |
Visibilité globale ou non des fonctions exportées depuis le diagramme dans le modèle Simulink. Lorsque cette propriété est activée, les blocs du modèle peuvent appeler les fonctions exportées du diagramme sans utiliser la notation qualifiée.
Dépendances
Pour activer ce paramètre, activez Export chart level functions.
Utilisation programmatique
Pour définir la valeur du paramètre du diagramme de manière programmatique, accédez à l'objet Stateflow.Chart du diagramme et modifiez la propriété de l'objet au moyen de la notation par points.
| Paramètre : | AllowGlobalAccessToExportedFunctions |
| Valeurs : | false or 0 (par défaut) | true or 1 |
| Types de données : | logical |
Activation ou non de la sémantique des super pas pour le diagramme. Sélectionnez ce paramètre pour permettre au diagramme d'effectuer plusieurs transitions à chaque pas de temps jusqu'à ce qu'il atteigne un état stable. Cette option n’est pas disponible quand vous définissez la propriété de diagramme Update method sur Continuous. Pour plus d’informations, veuillez consulter Super Step Semantics.
Dépendances
Pour activer ce paramètre, définissez Update method sur Discrete.
Utilisation programmatique
Pour définir la valeur du paramètre du diagramme de manière programmatique, accédez à l'objet Stateflow.Chart du diagramme et modifiez la propriété de l'objet au moyen de la notation par points.
| Paramètre : | EnableNonTerminalStates |
| Valeurs : | false or 0 (par défaut) | true or 1 |
| Types de données : | logical |
Nombre maximal de transitions pouvant être effectuées en un seul super pas. Pour plus d’informations, veuillez consulter Super Step Semantics.
Dépendances
Pour activer ce paramètre, activez Enable super step semantics.
Utilisation programmatique
Pour définir la valeur du paramètre du diagramme de manière programmatique, accédez à l'objet Stateflow.Chart du diagramme et modifiez la propriété de l'objet au moyen de la notation par points.
| Paramètre : | NonTerminalMaxCounts |
| Valeurs : | 1000 (par défaut) | positive integer |
| Types de données : | single | double | int8 | int16 | int32 | int64 | uint8 | uint16 | uint32 | uint64 |
Action que Stateflow doit entreprendre si le super pas dépasse le nombre maximal de transitions possible en un super pas. Pour plus d’informations, veuillez consulter Super Step Semantics.
Dépendances
Pour activer ce paramètre, activez Enable super step semantics.
Utilisation programmatique
Pour définir la valeur du paramètre du diagramme de manière programmatique, accédez à l'objet Stateflow.Chart du diagramme et modifiez la propriété de l'objet au moyen de la notation par points.
| Paramètre : | NonTerminalUnstableBehavior |
| Valeurs : | "Proceed" (par défaut) | "Throw Error" |
Depuis R2022b
Traitement ou non, par le diagramme, des données non scalaires présentant une dimension de longueur 1 comme étant de taille fixe. Lorsque vous sélectionnez ce paramètre, le diagramme traite les données non scalaires présentant au moins une dimension de longueur 1 comme étant de taille fixe, que vous activiez ou non la propriété de données Variable size. Lorsque vous effacez ce paramètre, le diagramme traite les données non scalaires dont la propriété Variable size est activée comme étant de taille variable.
Utilisation programmatique
Pour définir la valeur du paramètre du diagramme de manière programmatique, accédez à l'objet Stateflow.Chart du diagramme et modifiez la propriété de l'objet au moyen de la notation par points.
| Paramètre : | TreatDimensionOfLengthOneAsFixedSize |
| Valeurs : | true or 1 (par défaut) | false or 0 |
| Types de données : | logical |
Spécifiez les variants de bloc que Stateflow analyse lors de la simulation et de la génération de code. Selon l'option choisie, Stateflow détermine si le code généré doit contenir uniquement le choix actif ou à la fois les choix actifs et inactifs.
update diagram analyze all choices- Lorsque vous sélectionnez cette option, Stateflow analyse à la fois les choix actifs et inactifs à la recherche d'incompatibilités dans les attributs du signal et génère le code uniquement pour le choix actif.code compile- Lorsque vous sélectionnez cette option, Stateflow analyse à la fois les choix actifs et inactifs des transitions de variant et génère le code à la fois pour les choix actifs et inactifs. Les choix figurent dans les instructions conditionnelles #if et #endif du dispositif de prétraitement C, compilées de manière conditionnelle lorsque vous compilez le code généré.
Utilisation programmatique
Pour définir la valeur du paramètre du diagramme de manière programmatique, accédez à l'objet Stateflow.Chart du diagramme et modifiez la propriété de l'objet au moyen de la notation par points.
| Paramètre : | VariantActivationTime |
| Valeurs : | "update diagram analyze all choices" (par défaut) | "code compile" |
Langage d’action à utiliser pour programmer le diagramme, spécifié en tant que MATLAB ou C. Pour plus d’informations, veuillez consulter Differences Between MATLAB and C as Action Language Syntax.
Utilisation programmatique
Pour définir la valeur du paramètre du diagramme de manière programmatique, accédez à l'objet Stateflow.Chart du diagramme et modifiez la propriété de l'objet au moyen de la notation par points.
| Paramètre : | ActionLanguage |
| Valeurs : | "MATLAB" (par défaut) | "C" |
Sémantique des machines à états mise en oeuvre par le diagramme, spécifiée en tant que Classic, Mealy ou Moore. Pour plus d’informations, veuillez consulter Présentation des machines de Mealy et de Moore.
Utilisation programmatique
Pour définir la valeur du paramètre du diagramme de manière programmatique, accédez à l'objet Stateflow.Chart du diagramme et modifiez la propriété de l'objet au moyen de la notation par points.
| Paramètre : | StateMachineType |
| Valeurs : | "Classic" (par défaut) | "Mealy" | "Moore" |
Propriétés à virgule fixe
Signaux Simulink hérités à traiter en tant qu’objets Fixed-Point Designer™fi, spécifiés sous la forme de l’une des valeurs suivantes :
Fixed-point— Le diagramme traite toutes les entrées à virgule fixe en tant qu’objetsfi.Fixed-point & Integer— Le diagramme traite toutes les entrées entières et à virgule fixe en tant qu’objetsfi.
Dépendances
Pour activer ce paramètre, définissez Action language sur MATLAB.
Utilisation programmatique
Pour définir la valeur du paramètre du diagramme de manière programmatique, accédez à l'objet Stateflow.Chart du diagramme et modifiez la propriété de l'objet au moyen de la notation par points.
| Paramètre : | TreatAsFi |
| Valeurs : | "Fixed-point" (par défaut) | "Fixed-point & Integer" |
Propriétés fimath par défaut du diagramme, spécifiées sous la forme de l’une des valeurs suivantes :
Same as MATLAB- Le diagramme utilise les mêmes propriétés d'objetfimathque l'objetfimathpar défaut actuel. La zone de texte est grisée et affiche l'objetfimathglobal actuel en lecture seule.Specify other- Spécifiez votre propre objetfimathdans la zone de texte de l'une des deux manières suivantes :Construction de l’objet
fimathau sein de la zone de texte.Construction de l’objet
fimathdans le MATLAB ou l’espace de travail du modèle, puis saisie de son nom de variable dans la zone de texte. Si vous utilisez cette option et que vous prévoyez de partager votre modèle avec d’autres personnes, définissez la variable dans l’espace de travail du modèle.
Pour plus d’informations, veuillez consulter fimath Object Construction (Fixed-Point Designer).
Dépendances
Pour activer ce paramètre, définissez Action language sur MATLAB.
Utilisation programmatique
Pour définir la valeur du paramètre du diagramme de manière programmatique, accédez à l'objet Stateflow.Chart du diagramme et modifiez la propriété de l'objet au moyen de la notation par points.
| Paramètre : | EmlDefaultFimath |
| Valeurs : | "Same as MATLAB Default" (par défaut) | "Other:UserSpecified" |
Capacités étendues
Génération de code C/C++
Générez du code C et C++ avec Simulink® Coder™.
HDL Coder™ propose des options de configuration supplémentaires qui affectent l’implémentation HDL et la logique synthétisée.
Ce bloc dispose d’une seule architecture HDL par défaut.
Pour générer un port de sortie dans le code HDL indiquant l’état actif, sélectionnez Create output for monitoring dans la fenêtre « Properties » du diagramme. La sortie a un type de données énuméré. Consultez Simplifier les diagrammes Stateflow en incorporant la sortie de l’état actif.
Pour insérer un registre de sortie qui retarde la sortie du diagramme d’un cycle de simulation, utilisez la propriété de bloc OutputPipeline (HDL Coder).
| ClockDrivenOutput | Active les sorties pilotées par l’horloge pour éviter qu’elles ne soient pilotées par la logique combinatoire et pour permettre leur mise à jour immédiate lorsque le signal et l’état de l’horloge changent. La valeur par défaut est |
| ConstMultiplierOptimization | Optimisation par CSD (Canonical signed digit) ou CSD factorisé. La valeur par défaut est |
| ConstrainedOutputPipeline | Nombre de registres à placer aux sorties en déplaçant les délais existants dans votre design. Le pipelining distribué ne redistribue pas ces registres. La valeur par défaut est |
| DistributedPipelining | Distribution des registres de pipeline ou replanification des registres. La valeur par défaut est |
| GuardIndexVariables | Indiquez si les index de tableau doivent être extraits des instructions conditionnelles ou non. Lorsque vous activez certaines optimisations telles que le RAM Mapping, la diffusion en boucle, le partage, etc., les expressions sont déplacées hors des index de tableau. Une variable temporaire est créée pour l'expression, susceptible d’entraîner une erreur de dépassement d'index pendant la simulation. La valeur par défaut est |
| InputPipeline | Nombre d’étages de pipeline d’entrée à insérer dans le code généré. Le pipelining distribué et le pipelining contraint des sorties peuvent déplacer ces registres. La valeur par défaut est |
| InstantiateFunctions | Génère une |
| LoopOptimization | Permet de dérouler des boucles, les streamer ou ne pas les optimiser. La valeur par défaut est |
| MapPersistentVarsToRAM | Mappe les tableaux persistants sur la RAM. La valeur par défaut est |
| OutputPipeline | Nombre d’étages de pipeline de sortie à insérer dans le code généré. Le pipelining distribué et le pipelining contraint des sorties peuvent déplacer ces registres. La valeur par défaut est |
| ResetType | Supprime la génération de la logique de réinitialisation. La valeur par défaut est |
| SharingFactor | Nombre de ressources fonctionnellement équivalentes à mapper sur une seule ressource partagée. La valeur par défaut est 0. Consultez également Resource Sharing (HDL Coder). |
Le bloc prend part à ces optimisations HDL qui ont pour but d’optimiser la vitesse et l’espace.
Optimisation de la vitesse et de l’espace
| optimisation | Description |
|---|---|
| Specify Distributed Pipelining Settings (HDL Coder) | Le pipelining distribué, également appelé resynchronisation des registres, est une optimisation de la vitesse qui déplace les retards existants d’un design afin de réduire la trajectoire critique tout en préservant le comportement fonctionnel. |
| Resource Sharing (HDL Coder) | Le partage des ressources est une optimisation d’espace par le biais de laquelle HDL Coder identifie plusieurs ressources aux fonctions équivalentes et les remplace par une ressource unique. |
| Understand Delay Balancing in HDL Coder (HDL Coder) | Lorsque des optimisations ou des options de mise en oeuvre de blocs font apparaître des retards sur la trajectoire critique d'un modèle, Delay Balancing détecte ces retards, puis les répercute sur les autres trajectoires. |
| Clock-Rate Pipelining (HDL Coder) | Le pipelining à fréquence d'horloge est un cadre d'optimisation dans HDL Coder qui permet à d'autres optimisations de vitesse et d’espace d'appliquer un temps de latence à la fréquence d'horloge. |
| Specify Adaptive Pipelining Settings (HDL Coder) | L'optimisation de type pipelining adaptatif crée des modèles ou des combinaisons de blocs avec des registres capables d’améliorer la fréquence d'horloge réalisable et de réduire l'espace utilisé sur les cartes FPGA en insérant des registres de pipelining dans les blocs de votre design. |
| Estimation de la trajectoire critique (HDL Coder) | Pour identifier rapidement la trajectoire critique la plus probable de votre design, utilisez la fonction Estimation de la trajectoire critique. L’estimation de la trajectoire critique permet d’accélérer le processus itératif d’identification de la trajectoire critique. Pour connaître les blocs définis dans l'estimation de la trajectoire critique, voir Characterized Blocks (HDL Coder). |
Ce bloc supporte la génération de code pour les signaux complexes.
Pour connaître les restrictions applicables à l’utilisation des diagrammes, consultez Introduction to Stateflow HDL Code Generation (HDL Coder).
Lorsque vous appliquez des optimisations, le bloc présente les limitations suivantes :
Les diagrammes Stateflow dont la propriété State Machine Type est définie sur
Moorene prennent pas en charge les optimisations HDL.Les optimisations HDL ne sont pas prises en charge pour le diagramme Stateflow qui possède un port Trigger.
| UseExternalDefinition | Supprimez la définition de bloc dans le code généré. La valeur par défaut est |
Conversion en virgule fixe
Concevez et simulez des systèmes en virgule fixe avec Fixed-Point Designer™.
Historique des versions
Introduit avant R2006aDans une prochaine version, la propriété User-specified state/transition execution order sera supprimée. Cette propriété s’applique uniquement aux diagrammes utilisant le C comme langage d’action.
Lorsque vous activez cette propriété, les diagrammes exécutent des transitions et états parallèles dans l’ordre dans lequel vous les avez créés. Vous pouvez également déterminer manuellement l’ordre d’exécution.
Lorsque vous désactivez cette propriété, les diagrammes exécutent des transitions et états parallèles selon l’ordre implicite défini par la position physique.
Les transitions s’exécutent selon les éléments suivants :
Niveau hiérarchique du parent de chaque transition.
Libellés de la transition dans l’ordre suivant :
Libellés avec événements et conditions.
Libellés avec événements.
Libellés avec conditions.
Aucun libellé.
Position de la surface angulaire de la source de la transition. La transition dont la position d'horloge est la plus petite présente la priorité la plus élevée. Par exemple, une transition dont la position d’horloge se situe à 2 heures présente une priorité plus élevée qu'une transition dont la position est à 4 heures. La transition dont la position source se situe à 12 heures présente la priorité la plus faible.
Les états parallèles s’exécutent dans l’ordre suivant :
De haut en bas.
De gauche à droite.
Pour garantir la compatibilité de vos diagrammes à ordre implicite, activez la propriété User-specified state/transition execution order.
Pour convertir un diagramme en table de transition d’état, utilisez la fonction convertToSTT.
La nouvelle propriété Treat dimensions of length 1 as fixed size vous permet de spécifier le mode de traitement par les diagrammes des données non scalaires lorsqu’au moins une dimension présente une longueur de 1. Dans les versions antérieures à R2023a, les diagrammes traitaient les données non scalaires présentant au moins une dimension de longueur 1 comme étant de taille fixe, que vous activiez ou non la propriété de données Variable size.
MATLAB Command
You clicked a link that corresponds to this MATLAB command:
Run the command by entering it in the MATLAB Command Window. Web browsers do not support MATLAB commands.
Sélectionner un site web
Choisissez un site web pour accéder au contenu traduit dans votre langue (lorsqu'il est disponible) et voir les événements et les offres locales. D’après votre position, nous vous recommandons de sélectionner la région suivante : .
Vous pouvez également sélectionner un site web dans la liste suivante :
Comment optimiser les performances du site
Pour optimiser les performances du site, sélectionnez la région Chine (en chinois ou en anglais). Les sites de MathWorks pour les autres pays ne sont pas optimisés pour les visites provenant de votre région.
Amériques
- América Latina (Español)
- Canada (English)
- United States (English)
Europe
- Belgium (English)
- Denmark (English)
- Deutschland (Deutsch)
- España (Español)
- Finland (English)
- France (Français)
- Ireland (English)
- Italia (Italiano)
- Luxembourg (English)
- Netherlands (English)
- Norway (English)
- Österreich (Deutsch)
- Portugal (English)
- Sweden (English)
- Switzerland
- United Kingdom (English)