Tracés de surface et maillés
Visualisez les données 3D à l’aide de tracés de surface et maillés. Créez des surfaces composées de facettes pleines ou semi-transparentes et d’arêtes de facettes et créez des tracés maillés qui montrent uniquement les arêtes des facettes.
Fonctions
Propriétés
| Surface Properties | Chart surface appearance and behavior |
| Surface Properties | Primitive surface appearance and behavior |
| FunctionSurface Properties | Surface chart appearance and behavior |
| ImplicitFunctionSurface Properties | Implicit surface chart appearance and behavior |
| ParameterizedFunctionSurface Properties | Parameterized surface chart appearance and behavior |
Rubriques
- Créer des graphiques 3D
Cet exemple montre comment créer divers graphiques 3D dans MATLAB®.
- Changing Surface Properties
This example shows how to get properties of a surface plot in MATLAB® and change the property values to customize your plot.
- Representing Data as a Surface
You can visualize matrix data on a rectangular grid using surface plots.
- How Surface Plot Data Relates to a Colormap
Change the relationship between surface plot data and the colormap.
Informations connexes
Sélection d՚exemples
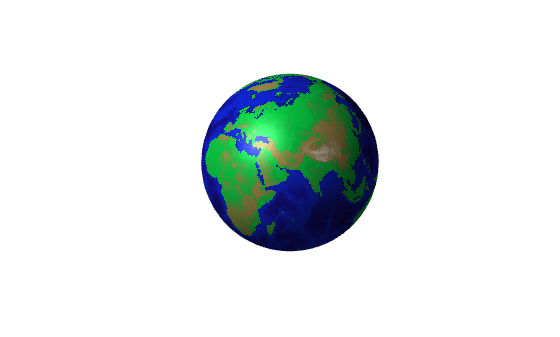
Displaying Topographic Data
Several ways to represent the Earth's topography. The data used in this example are available from the National Geophysical Data Center, NOAA US Department of Commerce under data announcement 88-MGG-02.
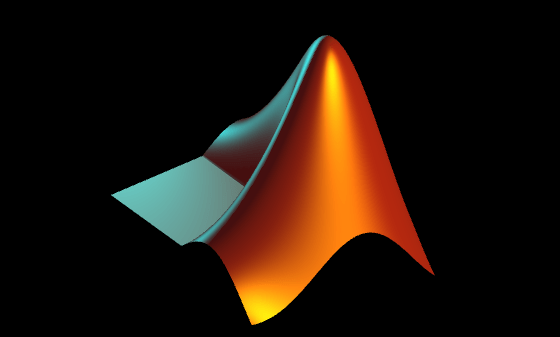
Creating the MATLAB Logo
Create and display the MATLAB® logo.