setMapData
Attribuer des données à la couche de carte
Syntaxe
Description
setMapData( spécifie un tableau de valeurs pour les emplacements xy donnés en coordonnées mondiales. L'entrée map,xy,mapData)mapData doit être un tableau X-by-1-by- DataDims . DataDims sont les dimensions des données cartographiques, map.DataSize(3:end). Les emplacements en dehors des limites de la carte sont ignorés.
setMapData( spécifie une matrice de valeurs map,bottomLeft,mapData)mapData pour une sous-région de la couche cartographique, map. La sous-région commence en bas à gauche xy-position bottomLeft et met à jour une sous-région en fonction de la taille de mapData.
setMapData( spécifie le coin inférieur gauche de la sous-région en coordonnées locales.map,bottomLeft,mapData,"local")
Exemples
Créez une couche de carte qui stocke deux valeurs par emplacement de grille sous forme de vitesses xy .
Créez une matrice de valeurs m par n par 2. Le premier élément de la troisième dimension est dx et le second est dy comme vitesses.
dXY = reshape(1:200,10,20);
dXY(:,:,2) = dXY;
Créez une couche de carte à partir de la matrice. Spécifiez la résolution et le nom du calque.
vLayer = mapLayer(dXY,'Resolution',1,'LayerName','dXY');
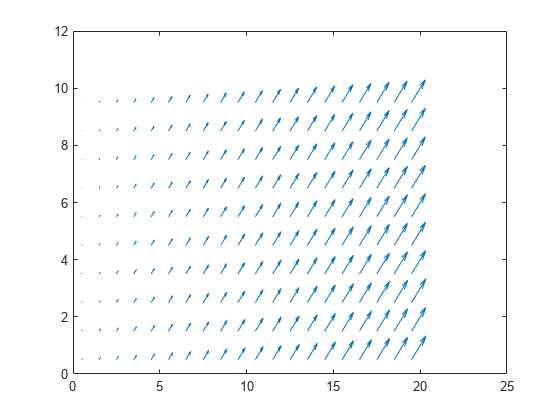
Obtenez toutes les données cartographiques sous forme de matrice. Obtenez les emplacements xy des valeurs de vitesse en créant des tableaux qui couvrent les limites minimales et maximales du monde xy et sont décalés vers les emplacements du centre de la grille. Les emplacements y sont inversés lors de la conversion entre la matrice et les coordonnées mondiales. Visualisez les vitesses correspondant à ces emplacements du centre de la grille à l'aide de la fonction quiver .
v = getMapData(vLayer);

R = 1/(2*vLayer.Resolution);
xLim = vLayer.XWorldLimits;
yLim = vLayer.YWorldLimits;
xLoc = (xLim(1)+R):R*2:(xLim(2)-R);
yLoc = (yLim(2)-R):-R*2:(yLim(1)+R);

quiver(xLoc,yLoc,v(:,:,1),v(:,:,2))
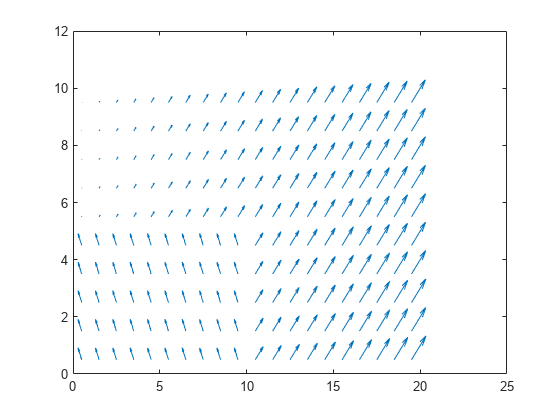
Définissez le quadrant inférieur gauche sur les nouvelles valeurs mises à jour. Créez les valeurs sous forme de matrice et spécifiez le coin inférieur gauche (0,0) dans les coordonnées de la carte à la fonction setData .
updateValues = repmat(reshape([-50,100],[1 1 2]),5,10);

setMapData(vLayer,[0 0],updateValues)
v = getMapData(vLayer);
quiver(xLoc,yLoc,v(:,:,1),v(:,:,2))
Définissez de nouvelles valeurs pour le quadrant supérieur gauche à l'aide des coordonnées de la grille. Pour les cartes, l'emplacement de la grille en haut à gauche est (1,1).
setMapData(vLayer,[1 1],updateValues,'grid')
v = getMapData(vLayer);
quiver(xLoc,yLoc,v(:,:,1),v(:,:,2))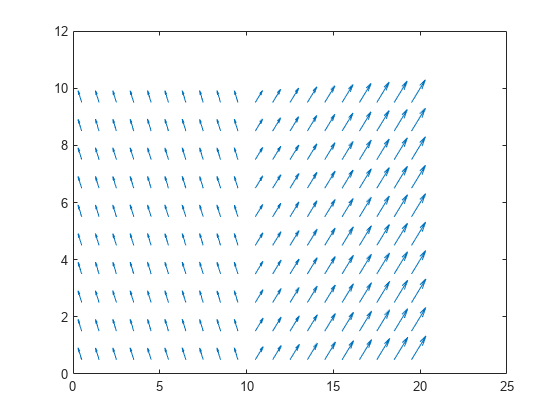
L'objet mapLayer vous permet d'appliquer des transformations personnalisées par élément lors de la définition et de l'obtention de données dans la carte. Pour transformer les données que vous définissez ou obtenez à partir de la carte, spécifiez les descripteurs de fonction pour les propriétés GetTransfomFcn et SetTransformFcn . Cet exemple montre comment implémenter une couche de carte probabiliste de log-cotes en créant une lookup table pour les valeurs de probabilité et de log-cotes. Les fonctions de transformation utilisent ces lookup tables pour convertir entre ces valeurs lors de la définition ou de l'obtention de données.
Créer des tables de recherche
Générez une lookup table complète de valeurs qui mappent les valeurs de probabilité aux limites minimale et maximale des valeurs int16 .
Créez un tableau de valeurs int16 de intmin à intmax. Définir les limites de probabilité.
intType = 'int16';
intLinSpace = intmin(intType):intmax(intType);
numOfPoints = length(intLinSpace);
probLimits = [0.001 .999];
Les fonctions exampleHelperProbToLogodds et examplerHelperLogoddsToProb sont secrètes entre les log-cotes et les valeurs de probabilité. Utilisez les fonctions d'assistance pour obtenir les limites des log-cotes et générer le tableau pour rechercher les valeurs des log-odds. Créez une grille interpolée pour l'ensemble de la lookup table.
logOddsLimits = exampleHelperProbToLogodds([0.001 .999]);
logOddsLookup = single(exampleHelperLogoddsToProb(linspace(logOddsLimits(1),logOddsLimits(2),numOfPoints)));
interpTable = griddedInterpolant(logOddsLookup,single(intLinSpace),'nearest');
Spécifier les poignées de la fonction de transformation
Les poignées de fonction de transformation utilisent des exemples d'assistants qui définissent comment convertir entre les valeurs entières de log-cotes et les valeurs de probabilité avec une limite de saturation appliquée. Les limites de saturation de probabilité sont [0.001 .999] comme spécifié précédemment. Ce comportement est similaire à l'objet occupancyMap .
getXformFcn = @(obj,logodds,varargin)...
    exampleHelperIntLogoddsToProb(logodds,logOddsLookup(:),intLinSpace);

setXformFcn = @(obj,prob,varargin)...
    exampleHelperProbToIntLogodds(prob,interpTable,logOddsLookup(:),intLinSpace,probLimits);
Créer une couche de carte
Générez un objet de couche de carte d'occupation à partir d'une matrice de valeurs de probabilité. Spécifiez les fonctions de transformation get et set.
occupancyLayer = mapLayer(repmat(0.5,10,10),...
                           'LayerName','Occupancy',...
                           'GetTransformFcn',getXformFcn,...
                           'SetTransformFcn',setXformFcn);
Notez que lorsque vous créez la carte, la valeur par défaut est 0,001 au lieu de 0. Cette différence est due au fait que la fonction SetTransformFcn a été appliquée à la valeur par défaut de 0 lors de la création de l'objet, ce qui sature la valeur à 0,001.
disp(occupancyLayer.DefaultValue)
0.0010
Obtenir et définir des données cartographiques
Les données cartographiques correspondent à la matrice que vous avez définie lors de la création.
extData = getMapData(occupancyLayer)
extData = 10×10

    0.5000    0.5000    0.5000    0.5000    0.5000    0.5000    0.5000    0.5000    0.5000    0.5000
    0.5000    0.5000    0.5000    0.5000    0.5000    0.5000    0.5000    0.5000    0.5000    0.5000
    0.5000    0.5000    0.5000    0.5000    0.5000    0.5000    0.5000    0.5000    0.5000    0.5000
    0.5000    0.5000    0.5000    0.5000    0.5000    0.5000    0.5000    0.5000    0.5000    0.5000
    0.5000    0.5000    0.5000    0.5000    0.5000    0.5000    0.5000    0.5000    0.5000    0.5000
    0.5000    0.5000    0.5000    0.5000    0.5000    0.5000    0.5000    0.5000    0.5000    0.5000
    0.5000    0.5000    0.5000    0.5000    0.5000    0.5000    0.5000    0.5000    0.5000    0.5000
    0.5000    0.5000    0.5000    0.5000    0.5000    0.5000    0.5000    0.5000    0.5000    0.5000
    0.5000    0.5000    0.5000    0.5000    0.5000    0.5000    0.5000    0.5000    0.5000    0.5000
    0.5000    0.5000    0.5000    0.5000    0.5000    0.5000    0.5000    0.5000    0.5000    0.5000
Définissez des emplacements de carte spécifiques sur des valeurs :
En dehors des limites de saturation des probabilités.
Précision supérieure à la résolution des lookup tables.
setMapData(occupancyLayer,[0 0],0.00001)
setMapData(occupancyLayer,[5 5],0.25999)
Pour la première localisation, la probabilité est liée aux limites de saturation.
extData = getMapData(occupancyLayer,[0 0])
extData = 0.0010
Le deuxième emplacement renvoie la valeur la plus proche de la valeur de probabilité dans la lookup table.
extData2 = getMapData(occupancyLayer,[5 5])
extData2 = 0.2600
La couche de carte générée peut désormais être utilisée pour mettre à jour une carte d'occupation de probabilité stockée sous la forme de valeurs int16 . Pour combiner cette carte avec d'autres couches ou types de cartes, consultez l'objet multiLayerMap .