Simulink.sdi.saveView
Save visualization settings to apply to other data
Description
Simulink.sdi.saveView( saves the
current view in the Simulation Data Inspector to the file, filename)filename.
A view contains information about the layout and plots in the graphical viewing area as well as properties of plotted signals. When you load a view, the Simulation Data Inspector uses the properties and preferences in the file to display data currently in the Simulation Data Inspector. Signals in the Simulation Data Inspector that align with the signals in the view are plotted in the graphical viewing area. Use a view to apply a consistent set of visualization settings to multiple sets of similar data.
The view file saves the following information:
Subplot layout and visualization type
Settings for each visualization type in the layout
Signal selection mode
Replay controls visibility
Metadata displayed in the work area
Settings for signal grouping in the work area
Plotted signals and the line style and color for each plotted signal
A view file does not contain data. To save run data, export the data or save a session
using the Simulink.sdi.save function.
Examples
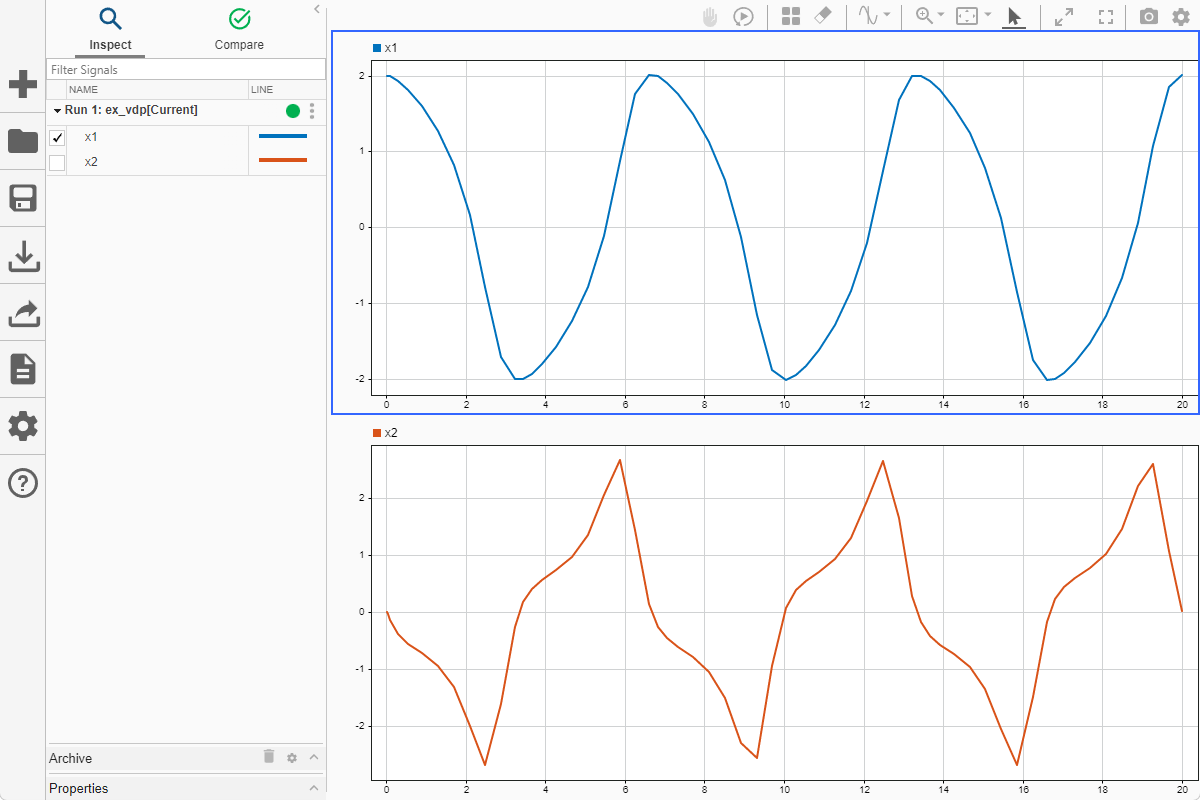
This example visualizes the output from the vdp model, saves the configuration as a view, and then uses the view to visualize the output from another simulation of the same model.
To generate data to plot in the Simulation Data Inspector, simulate the model.
mdl = "vdp";
open_system(mdl)
set_param("vdp/Mu","Gain","1")
sim(mdl);
Programmatically Configure and Save a View
The vdp model is configured to log two signals, x1 and x2. Plot each signal on a subplot in a 2-by-1 layout.
Simulink.sdi.setSubPlotLayout(2,1)
To plot one signal on each subplot, first access the Simulink.sdi.Run object for the simulation.
runIDs = Simulink.sdi.getAllRunIDs;
vdpRunID = runIDs(end);
vdpRun = Simulink.sdi.getRun(vdpRunID);
Then, you can access the data for each signal in a Simulink.sdi.Signal object and use the plotOnSubPlot function to specify where to plot each signal.
x1 = getSignalByIndex(vdpRun,1);
x2 = getSignalByIndex(vdpRun,2);

plotOnSubPlot(x1,1,1,true)
plotOnSubPlot(x2,2,1,true)
View the result in the Simulation Data Inspector.
Simulink.sdi.view
Then, save the view.
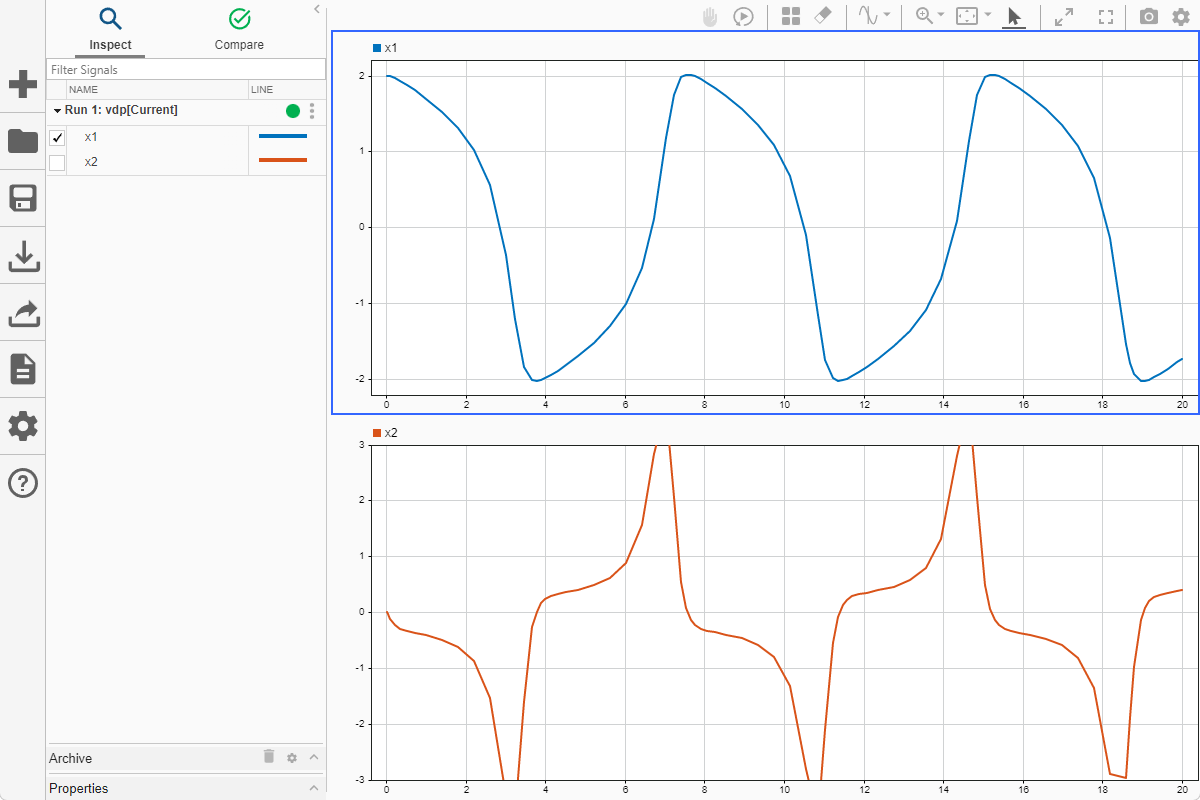
Simulink.sdi.saveView("vdpView.mldatx")Use the View
To mimic a situation where the Simulation Data Inspector is configured differently and contains data from another simulation, this example clears data from the Simulation Data Inspector, loads a view that represents the default visualization configuration, and runs another simulation of the vdp model.
Simulink.sdi.clear
Simulink.sdi.loadView("default.mldatx");
set_param("vdp/Mu","Gain","2")
sim("vdp");
Use the Simulink.sdi.loadView function to apply the saved view from the previous simulation.
Simulink.sdi.loadView("vdpView.mldatx")You can open the Simulation Data Inspector to view the results using the Simulink.sdi.view function. The saved view includes information regarding the axes limits. When you use a view to apply visualization settings, you may need to adjust axes limits or zoom levels to fit data from a modified simulation.
Input Arguments
Version History
Introduced in R2020a