permutationImportance
Syntax
Description
Importance = permutationImportance(Mdl)Mdl by permuting
the values in the predictor and comparing the model resubstitution loss with the original
predictor to the loss with the permuted predictor. A large increase in the model loss with
the permuted predictor indicates that the predictor is important. By default, the function
repeats the process over 10 permutations, and then averages the values. For more
information, see Permutation Predictor Importance.
Mdl must be a full classification or regression model that contains
the training data. That is, Mdl.X and Mdl.Y must be
nonempty. The returned Importance table contains the importance mean
and standard deviation for each predictor computed over 10 permutations.
Importance = permutationImportance(Mdl,Tbl,ResponseVarName)Tbl and the response values in the
ResponseVarName table variable.
Importance = permutationImportance(Mdl,Tbl,Y)Tbl and the response values in variable
Y.
Importance = permutationImportance(Mdl,X,Y)X and the response values in variable Y.
Importance = permutationImportance(___,Name=Value)NumPermutations name-value argument to change the number of
permutations used to compute the mean and standard deviation of the predictor importance
values for each predictor.
[
also returns the importance values computed for each predictor and permutation.Importance,ImportancePerPermutation] = permutationImportance(___)
[
also returns the mean and standard deviation of the importance values for each predictor and
class in Importance,ImportancePerPermutation,ImportancePerClass] = permutationImportance(___)Mdl.ClassNames. You can use this syntax when
Mdl is a classification model and the LossFun
value is a built-in loss function. For more information, see Permutation Predictor Importance per Class.
Examples
Compute the mean permutation predictor importance for the predictors in a regression support vector machine (SVM) model.
Load the carbig data set, which contains measurements of cars made in the 1970s and early 1980s. Create a table containing the predictor variables Acceleration, Displacement, and so on, as well as the response variable MPG.
load carbig
cars = table(Acceleration,Cylinders,Displacement, ...
    Horsepower,Model_Year,Weight,Origin,MPG);
Categorize the cars based on whether they were made in the USA.
cars.Origin = categorical(cellstr(cars.Origin));
cars.Origin = mergecats(cars.Origin,["France","Japan",...
    "Germany","Sweden","Italy","England"],"NotUSA");
Partition the data into two sets. Use approximately half of the observations for model training, and half of the observations for computing predictor importance.
rng("default") % For reproducibility
c = cvpartition(size(cars,1),"Holdout",0.5);
carsTrain = cars(training(c),:);
carsImportance = cars(test(c),:);
Train a regression SVM model using the carsTrain training data. Specify to standardize the numeric predictors. By default, fitrsvm uses a linear kernel function to fit the model.
Mdl = fitrsvm(carsTrain,"MPG",Standardize=true);Check the model for convergence.
Mdl.ConvergenceInfo.Converged
ans = logical
   1
The value 1 indicates that the model did converge.
To better understand the trained SVM model, visualize the linear kernel coefficients of the model. Note that the categorical predictor Origin is expanded into two separate predictors: Origin==USA and Origin==NotUSA.
[sortedCoefs,expandedIndex] = sort(Mdl.Beta,ComparisonMethod="abs");
sortedExpandedPreds = Mdl.ExpandedPredictorNames(expandedIndex);
bar(sortedCoefs,Horizontal="on")
yticklabels(strrep(sortedExpandedPreds,"_","\_"))
xlabel("Linear Kernel Coefficient")
title("Linear Kernel Coefficient per Predictor")

The Weight and Model_Year predictors have the greatest coefficient values, in terms of absolute value.
Compute the importance values of the predictors in Mdl by using the permutationImportance function. By default, the function uses 10 permutations to compute the mean and standard deviation of the importance values for each predictor in Mdl. For a fixed predictor and a fixed permutation of its values, the importance value is the difference in the loss due to the permutation of the values in the predictor. Because Mdl is a regression SVM model, permutationImportance uses the mean squared error (MSE) as the default loss function for computing importance values.
Importance = permutationImportance(Mdl,carsImportance)
Importance=7×3 table
      Predictor       ImportanceMean    ImportanceStandardDeviation
    ______________    ______________    ___________________________

    "Acceleration"       0.045464                 0.11925
    "Cylinders"           0.97081                 0.30542
    "Displacement"         1.4825                 0.60587
    "Horsepower"          0.85574                 0.53354
    "Model_Year"           13.696                  1.8971
    "Weight"               44.248                  4.0521
    "Origin"               3.8585                 0.59796
Visualize the mean importance values.
[sortedImportance,index] = sort(Importance.ImportanceMean);
sortedPreds = Importance.Predictor(index);
bar(sortedImportance,Horizontal="on")
yticklabels(strrep(sortedPreds,"_","\_"))
xlabel("Mean Importance")
title("Mean Importance per Predictor")

The Weight and Model_Year predictors have the greatest mean importance values. In general, the order of the predictors with respect to the mean importance matches the order of the predictors with respect to the absolute value of the linear kernel coefficients.
Compute the mean permutation predictor importance for the predictors in a classification neural network model. Calculate the per-class contributions to the predictor importance values.
Read the sample file CreditRating_Historical.dat into a table. The predictor data consists of financial ratios and industry sector information for a list of corporate customers. The response variable consists of credit ratings assigned by a rating agency. Preview the first few rows of the data set.
creditrating = readtable("CreditRating_Historical.dat");
head(creditrating)
ID WC_TA RE_TA EBIT_TA MVE_BVTD S_TA Industry Rating
_____ ______ ______ _______ ________ _____ ________ _______
62394 0.013 0.104 0.036 0.447 0.142 3 {'BB' }
48608 0.232 0.335 0.062 1.969 0.281 8 {'A' }
42444 0.311 0.367 0.074 1.935 0.366 1 {'A' }
48631 0.194 0.263 0.062 1.017 0.228 4 {'BBB'}
43768 0.121 0.413 0.057 3.647 0.466 12 {'AAA'}
39255 -0.117 -0.799 0.01 0.179 0.082 4 {'CCC'}
62236 0.087 0.158 0.049 0.816 0.324 2 {'BBB'}
39354 0.005 0.181 0.034 2.597 0.388 7 {'AA' }
Because each value in the ID variable is a unique customer ID, that is, length(unique(creditrating.ID)) is equal to the number of observations in creditrating, the ID variable is a poor predictor. Remove the ID variable from the table, and convert the Industry variable to a categorical variable.
creditrating = removevars(creditrating,"ID");
creditrating.Industry = categorical(creditrating.Industry);
Convert the Rating response variable to a categorical variable.
creditrating.Rating = categorical(creditrating.Rating, ...
    ["AAA","AA","A","BBB","BB","B","CCC"]);
Partition the data into two sets. Use approximately 80% of the observations to train a neural network classifier, and 20% of the observations to compute predictor importance.
rng("default") % For reproducibility
c = cvpartition(creditrating.Rating,"Holdout",0.20);
creditTrain = creditrating(training(c),:);
creditImportance= creditrating(test(c),:);
Train a neural network classifier by passing the training data creditTrain to the fitcnet function. Specify to standardize the numeric predictors. Change the relative gradient tolerance from 0.000001 (default) to 0.0005, so that the training process can stop earlier.
Mdl = fitcnet(creditTrain,"Rating",Standardize=true, ...
    GradientTolerance=5e-4);
Check the model for convergence.
Mdl.ConvergenceInfo.ConvergenceCriterion
ans =
'Relative gradient tolerance reached.'
The model stops training after reaching the relative gradient tolerance.
Compute the importance values of the predictors in Mdl by using the permutationImportance function. By default, the function uses 10 permutations to compute the mean and standard deviation of the importance values for each predictor in Mdl. For a fixed predictor and a fixed permutation of its values, the importance value is the difference in the loss due to the permutation of the values in the predictor. Because Mdl is a classification neural network model, permutationImportance uses the minimal expected misclassification cost as the default loss function for computing importance values.
Because Mdl is a multiclass classifier, additionally return the mean and standard deviation of the importance values per class for each predictor.
[Importance,~,ImportancePerClass] = ...
    permutationImportance(Mdl,creditImportance,"Rating")
Importance=6×3 table
    Predictor     ImportanceMean    ImportanceStandardDeviation
    __________    ______________    ___________________________

    "WC_TA"          0.014269                0.0062836
    "RE_TA"           0.18372                 0.013911
    "EBIT_TA"        0.030178                0.0068664
    "MVE_BVTD"        0.55744                 0.010545
    "S_TA"           0.048892                 0.010217
    "Industry"       0.074682                 0.011861
ImportancePerClass=6×3 table
    Predictor                                            ImportanceMean                                                                          ImportanceStandardDeviation
    __________    ____________________________________________________________________________________________    _________________________________________________________________________________________

                     AAA            AA            A           BBB           BB           B             CCC           AAA           AA            A           BBB          BB            B           CCC
                  __________    __________    _________    __________    ________    __________    ___________    __________    _________    _________    _________    _________    _________    __________

    "WC_TA"        0.0019072    1.0408e-18    0.0013986     0.0010172    0.010709    -0.0020343      0.0012715    0.00089906    0.0023214    0.0029637     0.002862    0.0029565     0.001818    0.00059937
    "RE_TA"         0.020979      0.015003     0.026446      0.014876    0.045514      0.039034       0.021869     0.0034561    0.0059274    0.0041003    0.0057817     0.007721    0.0024749    0.00053609
    "EBIT_TA"     0.00038144    -0.0021615    0.0055944    -0.0043229    0.016574       0.01424    -0.00012715     0.0010468    0.0019001     0.002824    0.0046116    0.0036557    0.0023824    0.00040207
    "MVE_BVTD"       0.11812      0.066497      0.08684       0.12982     0.10837      0.040559      0.0072473     0.0037646     0.003978    0.0052269    0.0083364    0.0050996    0.0035179     0.0020806
    "S_TA"        -0.0016529     0.0036872     0.006103      0.018563     0.02537    -0.0091545      0.0059758     0.0019001    0.0020281    0.0037335    0.0041612    0.0037266    0.0041003     0.0012062
    "Industry"     0.0012715     0.0054673     0.010935      0.027082    0.017594      0.011952     0.00038144     0.0021611     0.002616    0.0041612    0.0077002    0.0064951    0.0032938     0.0017006
Visualize the mean importance values.
bar(Importance.ImportanceMean,Horizontal="on")
yticklabels(strrep(Importance.Predictor,"_","\_"))
xlabel("Mean Importance")
title("Mean Importance per Predictor")

The MVE_BVTD predictor has the greatest mean importance value. This value indicates that permuting the values of MVE_BVTD leads to an increase in the minimal expected misclassification cost of about 0.55 (on average).
Visualize the mean importance values by class.
bar(ImportancePerClass.ImportanceMean{:,:}, ...
    "stacked",Horizontal="on")
legend(Mdl.ClassNames)
yticklabels(strrep(ImportancePerClass.Predictor,"_","\_"))
xlabel("Mean Importance")
title("Mean Importance per Predictor and Class")
Each segment indicates the mean importance value for the specified predictor and class. For example, the dark blue segment in the MVE_BVTD stacked bar indicates that the mean importance value for the MVE_BVTD predictor and the AAA class is slightly greater than 0.1. For each predictor, the sum of the segment values (including negative values) equals the mean predictor importance value.
Find the most important predictors in an SVM classifier by using the permutationImportance function. Use this subset of predictors to retrain the model. Ensure that the retrained model performs similarly to the original model on a test set.
This example uses the 1994 census data stored in census1994.mat. The data set consists of demographic information from the US Census Bureau that you can use to predict whether an individual makes over $50,000 per year.
Load the sample data census1994, which contains the training data adultdata and the test data adulttest. Preview the first few rows of the training data set.
load census1994
head(adultdata)
age workClass fnlwgt education education_num marital_status occupation relationship race sex capital_gain capital_loss hours_per_week native_country salary
___ ________________ __________ _________ _____________ _____________________ _________________ _____________ _____ ______ ____________ ____________ ______________ ______________ ______
39 State-gov 77516 Bachelors 13 Never-married Adm-clerical Not-in-family White Male 2174 0 40 United-States <=50K
50 Self-emp-not-inc 83311 Bachelors 13 Married-civ-spouse Exec-managerial Husband White Male 0 0 13 United-States <=50K
38 Private 2.1565e+05 HS-grad 9 Divorced Handlers-cleaners Not-in-family White Male 0 0 40 United-States <=50K
53 Private 2.3472e+05 11th 7 Married-civ-spouse Handlers-cleaners Husband Black Male 0 0 40 United-States <=50K
28 Private 3.3841e+05 Bachelors 13 Married-civ-spouse Prof-specialty Wife Black Female 0 0 40 Cuba <=50K
37 Private 2.8458e+05 Masters 14 Married-civ-spouse Exec-managerial Wife White Female 0 0 40 United-States <=50K
49 Private 1.6019e+05 9th 5 Married-spouse-absent Other-service Not-in-family Black Female 0 0 16 Jamaica <=50K
52 Self-emp-not-inc 2.0964e+05 HS-grad 9 Married-civ-spouse Exec-managerial Husband White Male 0 0 45 United-States >50K
Each row contains the demographic information for one adult. The last column, salary, shows whether a person has a salary less than or equal to $50,000 per year or greater than $50,000 per year.
Combine the education_num and education variables in both the training and test data to create a single ordered categorical variable that shows each person's highest level of education.
edOrder = unique(adultdata.education_num,"stable");
edCats = unique(adultdata.education,"stable");
[~,edIdx] = sort(edOrder);

adultdata.education = categorical(adultdata.education, ...
    edCats(edIdx),Ordinal=true);
adultdata.education_num = [];

adulttest.education = categorical(adulttest.education, ...
    edCats(edIdx),Ordinal=true);
adulttest.education_num = [];
Split the training data further using a stratified holdout partition. Create a separate data set to compute predictor importance by permutation. Reserve approximately 30% of the observations to compute permutation predictor importance values, and use the rest of the observations to train a support vector machine (SVM) classifier.
rng("default") % For reproducibility
c = cvpartition(adultdata.salary,"Holdout",0.30);
tblTrain = adultdata(training(c),:);
tblImportance = adultdata(test(c),:);
Train an SVM classifier by using the training set. Specify the salary column of tblTrain as the response and the fnlwgt column as the observation weights. Standardize the numeric predictors. Use a Gaussian kernel function to fit the model, and let fitcsvm select an appropriate kernel scale parameter.
Mdl = fitcsvm(tblTrain,"salary",Weights="fnlwgt", ...
    Standardize=true, ...
    KernelFunction="gaussian",KernelScale="auto");
Check the model for convergence.
Mdl.ConvergenceInfo.Converged
ans = logical
   1
The value 1 indicates that the model did converge.
Compute the weighted classification error using the test set adulttest.
L = loss(Mdl,adulttest,"salary", ...
    Weights="fnlwgt")
L =
0.1428
Compute the importance values of the predictors in Mdl by using the permutationImportance function and the tblImportance data. By default, the function uses 10 permutations to compute the mean and standard deviation of the importance values for each predictor in Mdl. For a fixed predictor and a fixed permutation of its values, the importance value is the difference in the loss due to the permutation of the values in the predictor. Because Mdl is a classification SVM model and observation weights are specified, permutationImportance uses the weighted classification error as the default loss function for computing importance values.
Importance = ...
    permutationImportance(Mdl,tblImportance,"salary", ...
    Weights="fnlwgt")
Importance=12×3 table
       Predictor        ImportanceMean    ImportanceStandardDeviation
    ________________    ______________    ___________________________

    "age"                   0.010591               0.0013485
    "workClass"            0.0091527               0.0016168
    "education"             0.032974               0.0040815
    "marital_status"        0.014259               0.0017183
    "occupation"            0.018904                0.001532
    "relationship"          0.013777               0.0012823
    "race"                -0.0012146              0.00055194
    "sex"                -6.7399e-05              0.00073437
    "capital_gain"          0.027692                0.001089
    "capital_loss"         0.0047561                0.000929
    "hours_per_week"       0.0062951               0.0018332
    "native_country"      0.00063405              0.00085922
Sort the predictors based on their mean importance values.
[sortedImportance,index] = sort(Importance.ImportanceMean, ...
    "descend");
sortedPreds = Importance.Predictor(index);

bar(sortedImportance)
xticklabels(strrep(sortedPreds,"_","\_"))
ylabel("Mean Importance")
title("Mean Importance per Predictor")

For model Mdl, the native_country, sex, and race predictors seem to have little effect on the prediction of a person's salary.
Retrain the SVM classifier using the nine most important predictors (and excluding the three least important predictors).
predSubset = sortedPreds(1:9)
predSubset = 9×1 string
    "education"
    "capital_gain"
    "occupation"
    "marital_status"
    "relationship"
    "age"
    "workClass"
    "hours_per_week"
    "capital_loss"
newMdl = fitcsvm(tblTrain,"salary",Weights="fnlwgt", ...
    PredictorNames=predSubset,Standardize=true, ...
    KernelFunction="gaussian",KernelScale="auto");
Compute the weighted test set classification error using the retrained model.
newL = loss(newMdl,adulttest,"salary", ...
    Weights="fnlwgt")
newL =
0.1437
newMdl has almost the same test set loss as Mdl and uses fewer predictors.
Train a multiclass support vector machine (SVM). Find the predictors in the model with the greatest median permutation predictor importance.
Load the humanactivity data set. The data set contains 24,075 observations of five physical human activities: sitting, standing, walking, running, and dancing. Each observation has 60 features extracted from acceleration data measured by smartphone accelerometer sensors. Create the response variable activity using the actid and actnames variables.
load humanactivity
activity = categorical(actid,1:5,actnames);
Partition the data into two sets. Use approximately 75% of the observations to train a multiclass SVM classifier, and 25% of the observations to compute predictor importance values.
rng("default") % For reproducibility
c = cvpartition(activity,"Holdout",0.25);
trainX = feat(training(c),:);
trainY = activity(training(c));
importanceX = feat(test(c),:);
importanceY = activity(test(c));
Train a multiclass SVM classifier by passing the training data trainX and trainY to the fitcecoc function.
Mdl = fitcecoc(trainX,trainY);
Compute the importance values of the predictors in Mdl by using the permutationImportance function. Return the importance value for each predictor and permutation.
[~,ImportancePerPermutation] = ...
permutationImportance(Mdl,importanceX,importanceY)ImportancePerPermutation=10×60 table
x1 x2 x3 x4 x5 x6 x7 x8 x9 x10 x11 x12 x13 x14 x15 x16 x17 x18 x19 x20 x21 x22 x23 x24 x25 x26 x27 x28 x29 x30 x31 x32 x33 x34 x35 x36 x37 x38 x39 x40 x41 x42 x43 x44 x45 x46 x47 x48 x49 x50 x51 x52 x53 x54 x55 x56 x57 x58 x59 x60
_________ ________ _________ ________ ________ __________ __________ ___________ __________ _______ ________ _________ ________ __________ __________ ___________ ___________ ___________ ___________ ___________ ___________ ___________ ___________ ___________ ___________ ___________ ___________ ___________ ___________ ________ ___________ ___________ ___________ __________ _________ _________ _________ _________ __________ ___________ __________ ___________ ___________ ___________ ___________ ___________ ___________ __________ ___________ __________ ___________ ________ _______ ___________ _______ _______ _________ _______ _______ ___________
0.0066458 0.049178 0.0028245 0.013955 0.074969 0.0024919 0.00066414 -0.001163 0.00099676 0.18847 0.019105 0.0078097 0.079749 0.0013287 0.00016614 0.00016631 -8.353e-08 -0.00016631 -0.00066473 0.00099676 0.00016606 -0.0006644 -0.00049859 8.353e-08 -1.6706e-07 0.00033203 0.00066423 -0.00099693 0.0011626 0.026083 -0.00083087 -0.00049867 -0.0008292 0.00049942 0.0033247 0.0041533 0.0096356 0.0033224 -8.353e-08 -0.00066473 0.0026579 1.0024e-06 -0.00033228 -0.00016589 -0.00033262 0.00016622 0.00016622 0.00033228 -0.0003327 0.00066456 -0.00099676 0.072604 0.17328 0.00049851 0.23065 0.52577 0.0026578 0.14106 0.22751 -0.00033228
0.0069782 0.047183 0.002658 0.014619 0.074803 0.0003317 0.00066406 -0.0003322 0.0006644 0.18713 0.01545 0.0084746 0.082575 0.00066406 0.00049842 0 0.00016589 -0.00033245 -0.00066473 0.0011628 0.0003322 -0.00099676 -0.00016614 -0.00049842 0.00033211 0.000498 0.00066431 -0.00099693 0.0011626 0.026417 -1.6706e-07 -0.00066481 -0.0011612 0.00099768 0.0023277 0.0051506 0.010301 0.0039868 0.0008307 -0.00033228 0.0021595 -0.0011621 0.00016614 -0.00049834 0.00033211 -0.00033228 -0.00016597 0.00066456 -0.00016647 0.00049842 -0.00066456 0.07277 0.17079 0.00033236 0.23065 0.5266 0.0031565 0.13641 0.22818 8.353e-08
0.0079751 0.04951 0.0021597 0.016114 0.075635 0.0018271 0.0026579 -0.00066448 0.0006644 0.19029 0.012791 0.0068125 0.075096 0.002658 0.00083079 8.353e-08 0.0003322 0.00016614 0.0003322 0.00099659 -0.00033262 -0.00083054 0 -0.0003322 0.0003322 -0.00016656 0.00099676 -8.353e-08 0.00016572 0.02492 -0.00016622 0.00016597 0.0014974 0.00083179 0.0029925 0.004818 0.010467 0.0044853 0.00016606 -0.00016606 0.0021596 -0.00033128 -0.00049842 -0.00066448 0.00016597 0.00033253 -0.0003322 0.00066456 0.00016597 0.00049842 -0.00016589 0.067121 0.17245 0.00016622 0.23198 0.52394 0.0021596 0.13442 0.22485 8.353e-08
0.0048182 0.051835 0.0046519 0.017942 0.074304 0.00099634 0.00066398 -0.00049834 0.00033211 0.18963 0.016946 0.0066467 0.074099 0.0014948 0.00066456 0.00049859 -0.00016631 -0.00016622 -0.00016614 0.00016572 -0.00033262 -0.00016589 -0.00033236 -0.00049851 0.00016597 0.00016572 0.00033203 -0.0003322 0.0003317 0.027413 -0.00016622 -0.00066473 0.00050051 0.00066548 0.0018293 0.0044857 0.011298 0.004153 0.00016606 -0.00016614 0.00083029 -0.00082962 -0.00033228 -0.00066465 -0.0003327 0.00066481 1.6706e-07 0.00049851 -3.3412e-07 0.00049842 -0.00033211 0.071607 0.17611 8.353e-08 0.2353 0.52278 0.0029902 0.13043 0.22386 8.353e-08
0.0048183 0.049677 0.0024921 0.014619 0.075633 0.0021594 0.00083012 -0.00016606 0.00066448 0.18331 0.014952 0.0069791 0.077589 0.001495 0.00016606 0.00016639 -0.00016631 -0.00016622 0 0.001495 -0.00049884 -0.00033211 -0.00033228 -0.00016606 0.00083079 0.00083037 -0.00016656 -0.00049842 0.0014948 0.026749 0.00033228 -0.00016631 0.00016831 0.0014965 0.0021617 0.0048185 0.0099684 0.0048175 0.0003322 -0.00033228 0.0014949 -0.00082962 -0.00049842 -0.00099668 -3.3412e-07 8.353e-08 8.353e-08 0.00033228 -3.3412e-07 0.00049851 -0.00099659 0.06845 0.16597 0.00016622 0.22982 0.52959 0.001827 0.13408 0.22585 -0.00016606
0.0058148 0.049676 0.0043197 0.014453 0.071978 0.0023255 0.00066389 -0.00016606 0.00099668 0.18132 0.01844 0.0069788 0.080913 0.0016613 0.0011629 -0.00016614 0.00049825 0.00016606 -0.00033228 0.00083054 -2.5059e-07 -0.00049825 -0.00016614 -0.0003322 -1.6706e-07 0.00049792 0.00083037 -0.00049842 0.00016556 0.023591 -0.00049851 -8.353e-08 0.0013315 0.00099776 0.0031584 0.0056489 0.010633 0.004153 0.00049834 -0.00033228 0.0024918 -0.00099618 -0.00016614 -0.00049842 0.0014953 1.6706e-07 -0.00049825 0.00016614 -0.00016647 0.00016614 -0.00049817 0.069613 0.1693 8.353e-08 0.23214 0.53059 0.0029904 0.14272 0.22485 8.353e-08
0.0064796 0.049676 0.0021595 0.016613 0.077463 0.0026577 0.0013287 -0.00049834 0.00083054 0.19362 0.01545 0.0073114 0.076094 0.0014948 0.00016606 0.00033245 0.00049834 -0.00066473 -0.00033236 0.001329 0.00049842 -0.00049825 -0.00066465 -0.00016606 -0.00049859 0.00033186 -2.5059e-07 -0.0013292 0.00066431 0.026914 0.00033211 -0.00016639 -0.00033028 0.00083171 0.0033247 0.0049841 0.010633 0.0039868 0.00049834 -0.00049842 0.00099643 -0.00066356 -0.00033228 1.6706e-07 -0.00049884 0.00016631 -0.0003322 0.00049842 0.00033195 0.00016614 -0.00033203 0.073268 0.16265 0.00033228 0.2348 0.5359 0.0024918 0.13741 0.22768 -0.00016606
0.0074768 0.049842 0.0029906 0.018108 0.072476 0.0024915 0.00049775 -0.00016614 0.00033211 0.1878 0.017942 0.0056499 0.075429 0.0013287 0.00099676 -0.00016614 0.00016597 0.00033236 0.00016614 0.0016613 -0.00016631 -0.00099668 -0.00066465 -0.00049851 0.0006644 0.00033178 0.001329 -0.0008307 -0.00016673 0.027247 0.0003322 0.00049825 1.8377e-06 0.00083179 0.0036571 0.0039873 0.0091372 0.0029896 0.00016606 -0.00016631 0.00016589 -0.00049742 -0.00049842 -0.00099676 0.00016597 0.00016622 8.353e-08 0.00016614 0.00049825 0.00016614 -0.00033211 0.067952 0.16764 0.00016622 0.23414 0.52543 0.002824 0.13957 0.22668 -0.0003322
0.0078087 0.053331 0.0034887 0.015118 0.075468 0.0016609 0.0019935 -0.0003322 0.00083054 0.18531 0.015284 0.0086405 0.076924 0.0016612 0.0003322 -0.00016606 0.00083054 -8.353e-08 -0.00049851 0.00049817 0.0006644 -0.001329 -0.00049842 -0.0003322 0.00016614 0.00066414 0.00049825 -0.00016622 0.00033178 0.025419 -0.00033245 -0.00033245 0.0013315 0.00033337 0.0021612 0.0034889 0.010134 0.0044854 0.00049834 -0.00049851 0.00099643 -0.0013283 -0.00049842 -0.00016597 -0.00016639 -0.0003322 -0.00016597 0.00016614 -0.00016656 0.00066456 -0.0014953 0.074265 0.17162 0.00016614 0.22749 0.52245 0.0028241 0.13608 0.23565 -0.00016606
0.0084735 0.050673 0.0029904 0.015616 0.075135 0.0014946 0.00066389 -0.00099684 0.00083054 0.19345 0.016779 0.0099698 0.077922 0.00099634 0.00033228 0.00049859 0.00016597 -0.00016622 -0.00033228 -2.5059e-07 0.0003322 -0.00049834 -8.353e-08 8.353e-08 0.0006644 -4.1765e-07 0.00066431 -0.00016606 0.0013287 0.027247 0.00016606 0.0003322 -0.00033036 0.00066556 0.0034908 0.0048179 0.010799 0.0046516 0.0003322 -0.00066465 0.0011626 -0.001827 -0.00033228 -0.00066448 0.0006644 0.00049859 -0.00016606 0.00016614 -4.1765e-07 0.00016614 -0.00033203 0.073933 0.17013 -0.00016622 0.22683 0.53325 0.0021594 0.13358 0.22934 8.353e-08
ImportancePerPermutation is a table of 10-by-60 predictor importance values, where each entry corresponds to permutation i of predictor p.
Compute the median permutation predictor importance for each predictor.
medianImportance = median(ImportancePerPermutation)
medianImportance=1×60 table
       x1          x2          x3           x4          x5          x6           x7            x8             x9          x10        x11          x12         x13          x14          x15           x16           x17            x18            x19           x20           x21            x22            x23           x24           x25           x26           x27            x28           x29          x30           x31            x32           x33           x34           x35         x36         x37         x38          x39           x40           x41           x42            x43            x44           x45          x46            x47           x48            x49           x50            x51          x52         x53         x54          x55        x56         x57         x58       x59          x60
    ________    ________    _________    ________    ________    _________    _________    ___________    __________    _______    ________    _________    ________    _________    __________    __________    __________    ___________    ___________    __________    __________    ___________    ___________    __________    __________    __________    __________    ___________    __________    ________    ___________    ___________    __________    __________    _________    ________    ________    ________    _________    ___________    _________    ___________    ___________    ___________    _________    __________    ___________    __________    ___________    __________    ___________    ________    _______    __________    _______    _______    _________    _______    ______    ___________

    0.006812    0.049676    0.0029075    0.015367    0.075052    0.0019933    0.0006641    -0.00041527    0.00074751    0.18813    0.016114    0.0071453    0.077257    0.0014948    0.00041535    8.3196e-05    0.00016597    -0.00016622    -0.00033228    0.00099668    8.2903e-05    -0.00058137    -0.00033232    -0.0003322    0.00024913    0.00033195    0.00066427    -0.00049842    0.00049805    0.026583    -8.3196e-05    -0.00016635    8.5075e-05    0.00083175    0.0030754    0.004818    0.010384    0.004153    0.0003322    -0.00033228    0.0013288    -0.00082962    -0.00033228    -0.00058145    8.282e-05    0.00016622    -0.00016597    0.00033228    -3.7588e-07    0.00049842    -0.00041514    0.072105    0.17046    0.00016622    0.23131    0.52618    0.0027409    0.13624    0.2271    -8.2987e-05
Plot the median predictor importance values. For reference, plot the line.
bar(medianImportance{1,:})
hold on
yline(0.05,"--")
hold off
xlabel("Predictor")
ylabel("Median Importance")
title("Median Importance per Predictor")
Only ten predictors have median predictor importance values that are greater than 0.05.
Compute the mean permutation predictor importance for the predictors in a discriminant analysis classifier. Use a loss function that corresponds to the error rate.
Load Fisher's iris data set. Determine the number of unique classes.
fishertable = readtable("fisheriris.csv");
K = length(unique(fishertable.Species));
Create a default misclassification cost matrix where 0 corresponds to a correct classification and 1 corresponds to a misclassification.
Cost = ones(K) - eye(K)
Cost = 3×3

     0     1     1
     1     0     1
     1     1     0
Train a discriminant analysis classifier using the entire data set and the cost matrix.
rng(0,"twister")  % For reproducibility
Mdl = fitcdiscr(fishertable,"Species",Cost=Cost);
Predict labels for the data set and return class scores.
[label,s,~] = predict(Mdl,fishertable);
Create a dummy variable matrix that contains the true classifications.
C = dummyvar(categorical(fishertable.Species));
Calculate the mean permutation predictor importance for the predictors using a loss function that does not use observation weights (shown at the end of this example). For each observation, the loss function applies misclassification costs to the classification score, and then finds the class with the highest score and compares it to the true class. The loss value is the fraction of misclassified observations (that is, the error rate).
Importance = permutationImportance(Mdl,lossFun=@ErrorRate);
Sort the predictors based on their mean importance values. Display a bar chart.
[sortedImportance,index] = sort(Importance.ImportanceMean);
sortedPreds = Importance.Predictor(index);
bar(sortedImportance,Horizontal="on")
yticklabels(strrep(sortedPreds,"_","\_"))
xlabel("Mean Importance")
title("Mean Importance per Predictor")
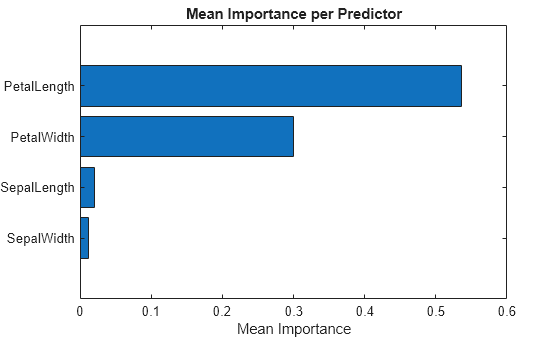
The PetalLength and PetalWidth predictors have the strongest influence on the model's predictions.
Error Rate Loss Function
This loss function returns a loss value that is equal to the fraction of misclassified observations (the error rate). The Classification Learner app uses this function when you create a permutation importance plot. If you specify a nondefault classification cost matrix, and the model is a k-nearest neighbor (KNN), discriminant analysis, or naive Bayes model, the app uses a modified version of this function that applies costs to scores.
function loss = ErrorRate(C, s, ~, Cost)
    % C is the N-by-K logical matrix for N observations and K classes
    % indicating the class to which the corresponding observation belongs.
    % The column order corresponds to the class order in Mdl.ClassNames.
    % s is the N-by-K matrix of predicted scores.
    % Cost is the K-by-K numeric matrix of misclassification costs.
    %
    % Uncomment the following line for k-nearest neighbor, discriminant analysis,
    % and naive Bayes models when you specify a nondefault cost matrix.
    % s = s*(-Cost); %  Apply costs to scores.
    %
    % Find the class with the highest score for each observation.
    [~, predictedClass] = max(s, [], 2);
    % Find the true class for each observation.
    [~, trueClass] = max(C, [], 2);
    % Calculate the number of misclassified observations.
    misclassified = trueClass ~= predictedClass;
    % Calculate the unweighted classification error.
    loss = sum(misclassified) / length(misclassified);
end
Input Arguments
Name-Value Arguments
Output Arguments
Algorithms
Extended Capabilities
Version History
Introduced in R2024a