Plot Spectral Representations of Signal in App Designer
This example shows how to create, design, set up, and run an app that plots three spectral representations of an input signal: Welch power spectral density (PSD) estimate, octave spectrum, and scalogram.
Introduction
You can plot the outputs from Signal Processing Toolbox™ and Wavelet Toolbox™ functions in apps created using App Designer. Use the Parent name-value argument of the following functions to specify an axes or panel container:
(Since R2025a)
spectrogram(Signal Processing Toolbox)(Since R2026a)
cpsd(Signal Processing Toolbox),mscohere(Signal Processing Toolbox),periodogram(Signal Processing Toolbox),poctave(Signal Processing Toolbox),pspectrum(Signal Processing Toolbox),pwelch(Signal Processing Toolbox),stft(Signal Processing Toolbox),tfestimate(Signal Processing Toolbox),xspectrogram(Signal Processing Toolbox),cwt, andmodwtmra
Creating a functional app in App Designer typically involves these steps:
Design the user interface (UI) — Add UI components such as buttons, displays, and other interactive elements. In this step, you can create axes or panel containers on which to plot output.
Write callback functions — Define the app behavior during execution by defining functions that respond to user interactions. In this step, you can include the
Parentname-value argument to specify the target parent container within the UI.
The next sections show how to implement these steps, run the designed app, and display the plotted spectral representations.
Note: This example includes a presaved app that you can run and explore. To run the presaved app, uncomment this code.
% spectralPlotCreate App and Design UI
Open App Designer by typing appdesigner in the MATLAB® command prompt. In the App Designer Start Page, select Blank App.
To add a UI component to the app, drag the component from the Component Library onto the app canvas. For more information, see Create and Run a Simple App Using App Designer. Follow these steps to design the app:
Add two vertically aligned Edit Field (Text) components. Label the top edit field component as MAT File Name and set the editable text field to
helidata. Label the bottom edit field component as Signal Name and set the editable text field tovib. You can specify the MAT file name that contains the input signal and the input signal variable name in the editable text fields.Add an Edit Field (Numeric) component under the two previously created edit field components. Label the edit field component as Sample Rate (Hz) and set the editable numeric field to
500. The editable numeric field contains the sample rate of the input signal.Add a Button component under the edit field components and label it as Plot.
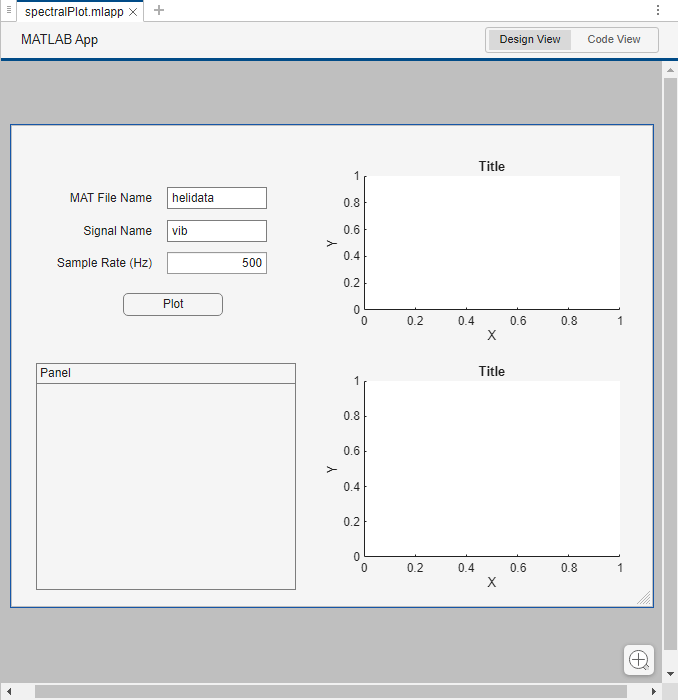
Add two Axes components and a Panel component in the remaining space of the app canvas.
Save the app. In the dialog, write an app name of your choice. This example saves the app as spectralPlot.mlapp.
The following figure shows the Design View of the app.
Set Up App with Function Callback
To plot the spectral representations of the input signal in the app, add a callback function to the Plot button by completing the following steps:
Select the Plot button, navigate to the Component browser and click Callbacks. In the ButtonPushedFcn drop-down menu, select
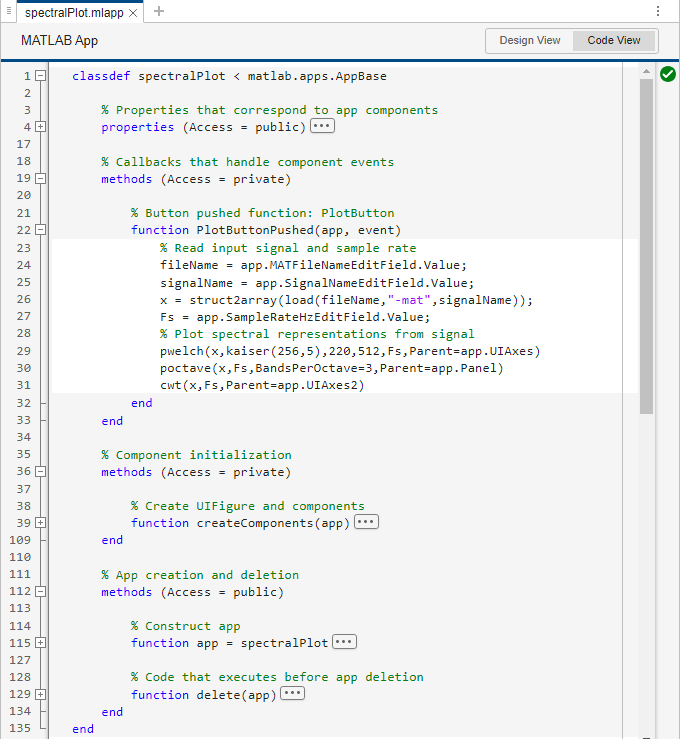
<add ButtonPushedFcn callback>. The Design View changes to Code View and the cursor directs to thePlotButtonPushedcallback function.Under the
PlotButtonPushedcallback function, write the commands that the app executes once you press the Plot button while the app is running. To plot the Welch PSD estimate, the octave spectrum, and the scalogram from the input signal on the axes or panel container, specify theParentname-value argument of thepwelch,poctave, andcwtfunctions, respectively.
For more information about callbacks, see Callbacks in App Designer.
Once you add the callback, save the app. This image shows the Code View of the app.
Run App and Visualize Signal Representation Plots
Run the app.
If you have the app open, press the Run button. You can run the app whether it is in Code View or Design View.
If you saved the app, you can also run it programmatically from the MATLAB Command Window by typing the app file name.
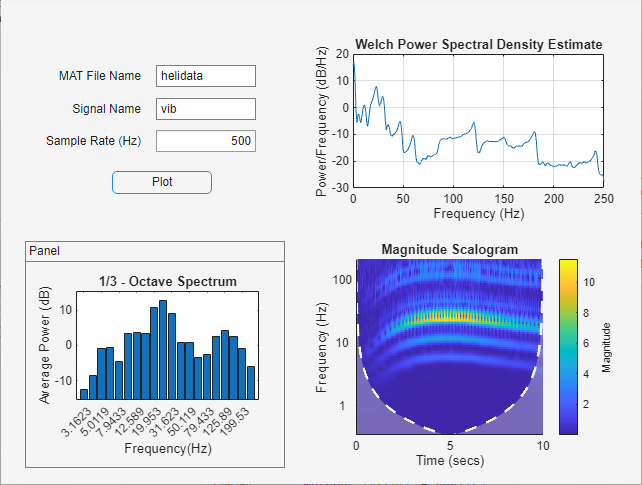
Click the Plot button. The app loads the variable vib from the MAT file helidata.mat and uses a sample rate of 500 Hz to compute the Welch PSD estimate, the octave spectrum, and the scalogram of vib. Then, the app plots the results in the specified axes and panel containers.
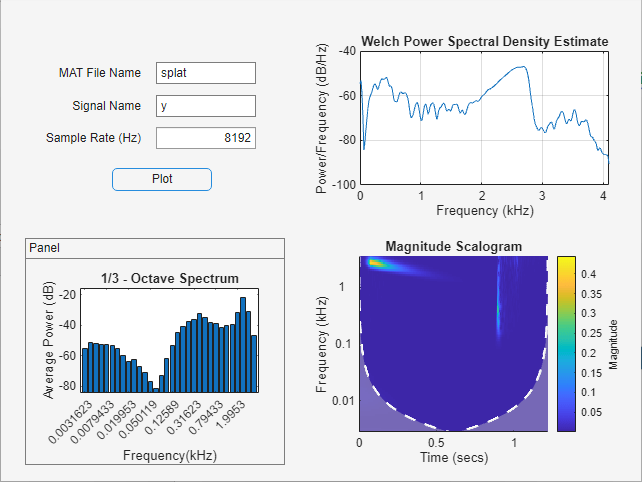
Now, set the MAT file name to splat, the signal name to y, and the sample rate to 8192. Click the Plot button to visualize the spectral representations of the signal y from the splat.mat file, sampled at a rate of 8192 Hz.
See Also
Tools
Functions
cwt|modwtmra|periodogram(Signal Processing Toolbox) |poctave(Signal Processing Toolbox) |pspectrum(Signal Processing Toolbox) |pwelch(Signal Processing Toolbox) |spectrogram(Signal Processing Toolbox) |stft(Signal Processing Toolbox)