plomb
Lomb-Scargle periodogram
Syntax
Description
[
returns the Lomb-Scargle power spectral density (PSD) estimate,
pxx,f]
= plomb(x,t)pxx, of a signal, x, that is
sampled at the instants specified in t.
t must increase monotonically but need not be uniformly
spaced. All elements of t must be nonnegative.
pxx is evaluated at the frequencies returned in
f.
If
xis a vector, it is treated as a single channel.If
xis a matrix, thenplombcomputes the PSD independently for each column and returns it in the corresponding column ofpxx.
x or t can contain
NaNs or NaTs. These values are treated
as missing data and excluded from the spectrum computation.
[
estimates the PSD up to a maximum frequency, pxx,f]
= plomb(___,fmax)fmax, using
any of the input arguments from previous syntaxes. If the signal is sampled at
N non-NaN instants, and Δt is the time difference between the first and the last of them,
then pxx is returned at
round(fmax / fmin)
points, where fmin = 1/(4 × N × ts) is the smallest frequency at which pxx is
computed and the average sample time is ts = Δt/(N – 1). fmax defaults to 1/(2 × ts), which for uniformly sampled signals corresponds to the
Nyquist frequency.
[
specifies an integer oversampling factor, pxx,f]
= plomb(___,fmax,ofac)ofac. The use of
ofac to interpolate or smooth a spectrum resembles the
zero-padding technique for FFT-based methods. pxx is again
returned at
round(fmax/fmin)
frequency points, but the minimum frequency considered in this case is
1/(ofac × N × ts).
ofac defaults to 4.
[___,
returns the power-level threshold, pth] = plomb(___,'Pd',pdvec)pth, such that a peak
with a value larger than pth has a probability
pdvec of being a true signal peak and not the result of
random fluctuations. pdvec can be a vector. Every element
of pdvec must be greater than 0 and smaller than 1. Each
row of pth corresponds to an element of
pdvec. pth has the same number of
channels as x. This option is not available if you specify
the output frequencies in fvec.
[
returns the PSD estimate of pxx,w]
= plomb(x)x evaluated at a set of evenly
spaced normalized frequencies, w, spanning the Nyquist
interval. Use NaNs to specify missing samples. All of the
above options are available for normalized frequencies. To access them, specify
an empty array as the second input.
plomb(___) with no output arguments plots the
Lomb-Scargle periodogram PSD estimate in the current figure window.
Examples
The Lomb-Scargle method can handle signals that have been sampled unevenly or have missing samples.
Generate a two-channel sinusoidal signal sampled at 1 kHz for about 0.5 s. The sinusoid frequencies are 175 Hz and 400 Hz. Embed the signal in white noise with variance .
Fs = 1000;
f0 = 175;
f1 = 400;

t = 0:1/Fs:0.5;

wgn = randn(length(t),2)/2;

sigOrig = sin(2*pi*[f0;f1]*t)' + wgn;
Compute and plot the periodogram of the signal. Use periodogram with the default settings.
periodogram(sigOrig,[],[],Fs)

axisLim = axis;
title('Periodogram')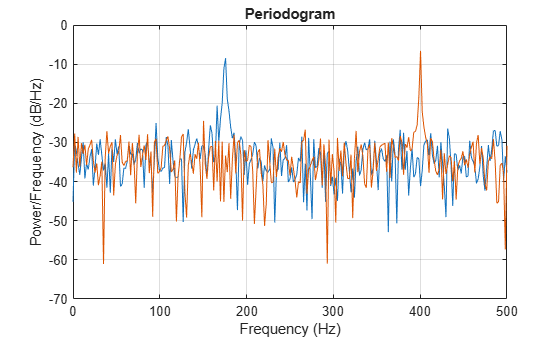
Use plomb with the default settings to estimate and plot the PSD of the signal. Use the axis limits from the previous plot.
plomb(sigOrig,t)

axis(axisLim)
title('Lomb-Scargle')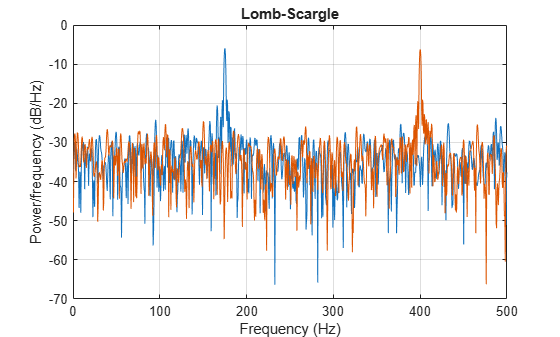
Suppose the signal is missing 10% of the original samples. Place NaNs in random locations to simulate the missing data points. Use plomb to estimate and plot the PSD of the signal with missing samples.
sinMiss = sigOrig;

misfrac = 0.1;
nTime = length(t)*2;

sinMiss(randperm(nTime,round(nTime*misfrac))) = NaN;

plomb(sinMiss,t)

axis(axisLim)
title('Missing Samples')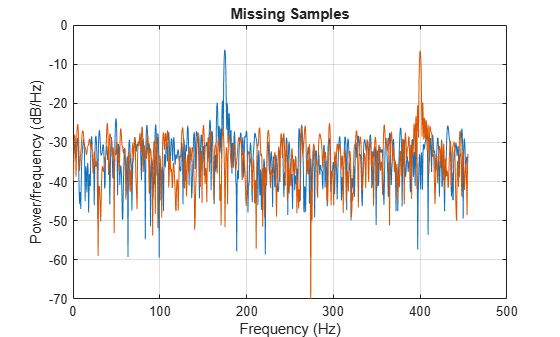
Sample the original signal, but make the sampling nonuniform by adding jitter (uncertainty) to the time measurements. The first instant continues to be at zero. Use plomb to estimate and plot the PSD of the nonuniformly sampled signal.
tirr = t + (1/2-rand(size(t)))/Fs/2;
tirr(1) = 0;

sinIrreg = sin(2*pi*[f0;f1]*tirr)' + wgn;

plomb(sinIrreg,tirr)

axis(axisLim)
title('Nonuniform Sampling')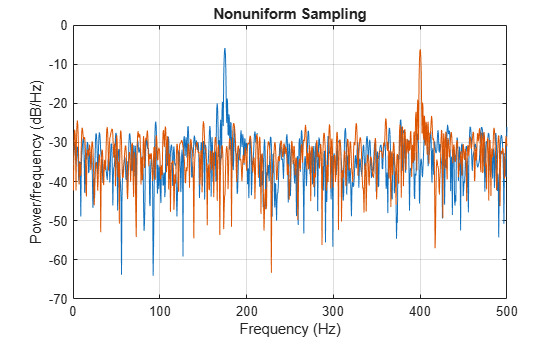
Galileo Galilei observed the motion of Jupiter's four largest satellites during the winter of 1610. When the weather allowed, Galileo recorded the satellites' locations. Use his observations to estimate the orbital period of one of the satellites, Callisto.
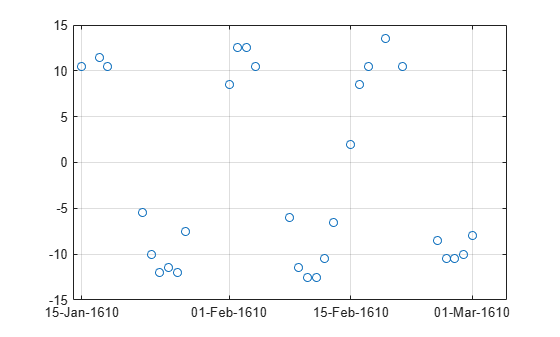
Callisto's angular position is measured in minutes of arc. Missing data due to cloudy conditions are specified using NaNs. The first observation is dated January 15. Generate a datetime array of observation times.
yg = [10.5 NaN 11.5 10.5 NaN NaN NaN -5.5 -10.0 -12.0 -11.5 -12.0 -7.5 ...
    NaN NaN NaN NaN 8.5 12.5 12.5 10.5 NaN NaN NaN -6.0 -11.5 -12.5 ...
    -12.5 -10.5 -6.5 NaN 2.0 8.5 10.5 NaN 13.5 NaN 10.5 NaN NaN NaN ...
    -8.5 -10.5 -10.5 -10.0 -8.0]';

obsv = datetime(1610,1,14+(1:length(yg)));

plot(yg,'o')

ax = gca;
nights = [1 18 32 46];
ax.XTick = nights;
ax.XTickLabel = char(obsv(nights));
grid
Estimate the power spectrum of the data using plomb. Specify an oversampling factor of 10. Express the resulting frequencies in inverse days.
[pxx,f] = plomb(yg,obsv,[],10,'power');
f = f*86400;
Use findpeaks to determine the location of the only prominent peak of the spectrum. Plot the power spectrum and show the peak.
[pk,f0] = findpeaks(pxx,f,'MinPeakHeight',10);

plot(f,pxx,f0,pk,'o')
xlabel('Frequency (day^{-1})')
title('Power Spectrum and Prominent Peak')
grid
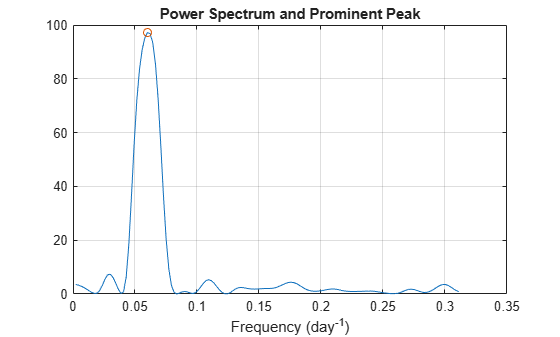
Determine Callisto's orbital period (in days) as the inverse of the frequency of maximum energy. The result differs by less than 1% from the value published by NASA.
Period = 1/f0
Period =
16.6454
NASA = 16.6890184;
PercentDiscrep = (Period-NASA)/NASA*100
PercentDiscrep =
-0.2613
Galileo Galilei discovered Jupiter's four largest satellites in January of 1610 and recorded their locations every clear night until March of that year. Use Galileo's data to find the orbital period of Callisto, the outermost of the four satellites.
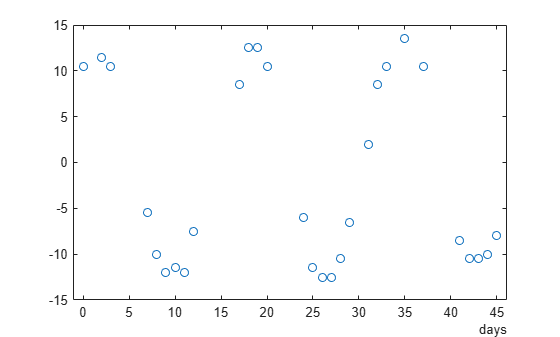
Galileo's observations of Callisto's angular position are in minutes of arc. There are several gaps due to cloudy conditions. Generate a duration array of observation times.
t = [0 2 3 7 8 9 10 11 12 17 18 19 20 24 25 26 27 28 29 31 32 33 35 37 ...
    41 42 43 44 45]';
td = days(t);

yg = [10.5 11.5 10.5 -5.5 -10.0 -12.0 -11.5 -12.0 -7.5 8.5 12.5 12.5 ...
    10.5 -6.0 -11.5 -12.5 -12.5 -10.5 -6.5 2.0 8.5 10.5 13.5 10.5 -8.5 ...
    -10.5 -10.5 -10.0 -8.0]';

plot(td,yg,'o')
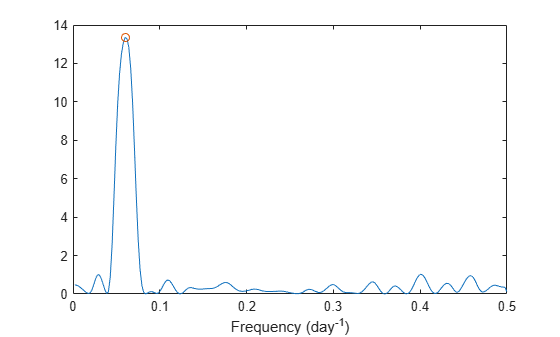
Use plomb to compute the periodogram of the data. Estimate the power spectrum up to a frequency of . Specify an oversampling factor of 10. Choose the standard Lomb-Scargle normalization.
oneday = seconds(days(1));

[pxx,f] = plomb(yg,td,0.5/oneday,10,'normalized');

f = f*oneday;
The periodogram has one clear maximum. Name the peak frequency . Plot the periodogram and annotate the peak.
[pmax,lmax] = max(pxx);
f0 = f(lmax);

plot(f,pxx,f0,pmax,'o')
xlabel('Frequency (day^{-1})')
Use linear least squares to fit to the data a function of the form
The fitting parameters are the amplitudes A, B, and C.
ft = 2*pi*f0*t;

ABC = [ones(size(ft)) cos(ft) sin(ft)] \ yg
ABC = 3×1

    0.4243
   10.4444
    6.6137
Use the fitting parameters to construct the fitting function on a 200-point interval. Plot the data and overlay the fit.
x = linspace(t(1),t(end),200)';
fx = 2*pi*f0*x;

y = [ones(size(fx)) cos(fx) sin(fx)] * ABC;

plot(td,yg,'o',days(x),y)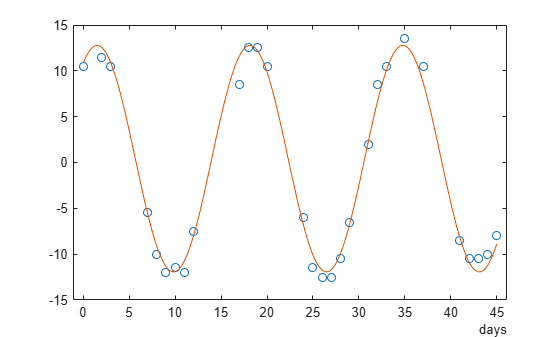
Sample a 0.8 Hz sinusoid at 1 Hz for 100 s. Embed the sinusoid in white noise with a variance of 1/100. Reset the random number generator for repeatable results.
f0 = 0.8;

rng default
wgn = randn(1,100)/10;

ts = 1:100;
s = sin(2*pi*f0*ts) + wgn;
Compute and plot the power spectral density estimate up to the sample rate. Specify an oversampling factor of 10.
plomb(s,ts,1,10)
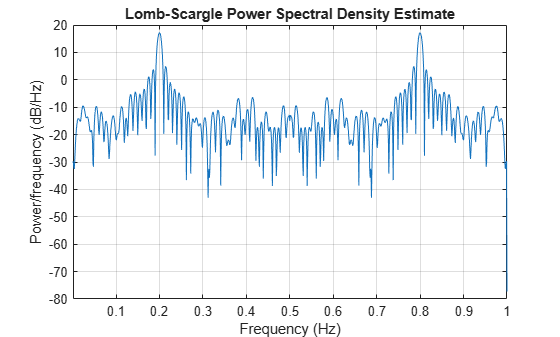
There is aliasing because the frequency of the sinusoid is greater than the Nyquist frequency.
Repeat the calculation, but now sample the sinusoid at random times. Include frequencies up to 1 Hz. Specify an oversampling factor of 2. Plot the PSD.
tn = sort(100*rand(1,100));
n = sin(2*pi*f0*tn) + wgn;

ofac = 2;

plomb(n,tn,1,ofac)
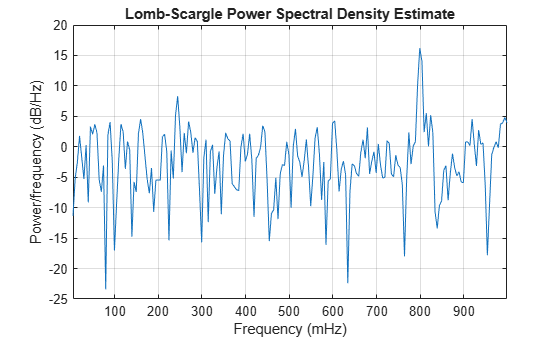
The aliasing disappears. The irregular sampling increases the effective sample rate by shrinking some time intervals.
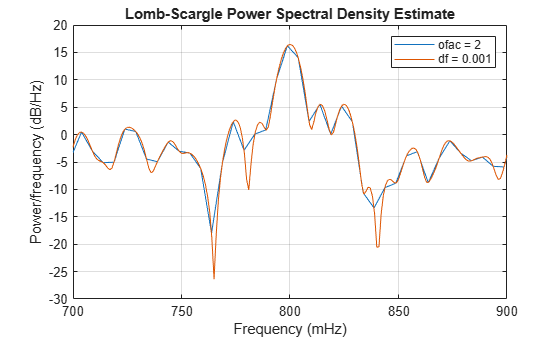
Zoom in on the frequencies around 0.8 Hz. Use a fine grid with a spacing of 0.001 Hz. You cannot specify an oversampling factor or a maximum frequency in this case.
df = 0.001;
fvec = 0.7:df:0.9;

hold on
plomb(n,tn,fvec)
legend('ofac = 2','df = 0.001')
Generate samples of white noise with variance , given a sample rate of 1 Hz. Compute the power spectrum of the white noise. Choose the Lomb-Scargle normalization and specify an oversampling factor . Reset the random number generator for repeatable results.
rng default

N = 1024;
t = (1:N)';
wgn = randn(N,1);

ofac = 15;
[pwgn,f] = plomb(wgn,t,[],ofac,'normalized');
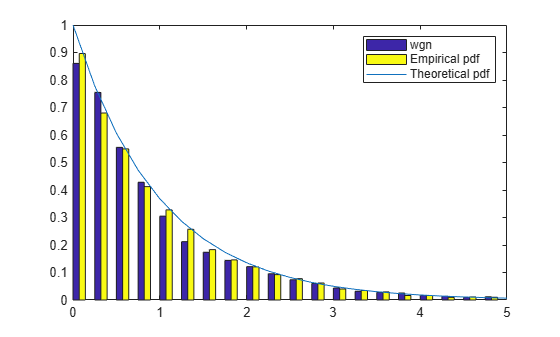
Verify that the Lomb-Scargle power spectrum estimate of white noise has an exponential distribution with unit mean. Plot a histogram of the values of pwgn and a histogram of a set of exponentially distributed random numbers generated using the distribution function . To normalize the histograms, recall that the total number of periodogram samples is . Specify a bin width of 0.25. Overlay a plot of the theoretical distribution function.
dx = 0.25;
br = 0:dx:5;

Nf = N*ofac/2;

hpwgn = histcounts(pwgn,br)';

hRand = histcounts(-log(rand(Nf,1)),br)';

bend = br(1:end-1);

bar(bend,[hpwgn hRand]/Nf/dx,'histc')
hold on
plot(br,exp(-br))
legend('wgn','Empirical pdf','Theoretical pdf')
hold off
Embed in the noise a sinusoidal signal of frequency 0.1 Hz. Use a signal-to-noise ratio of . Specify the sinusoid amplitude, , using the relation . Compute the power spectrum of the signal and plot its histogram alongside the empirical and theoretical distribution functions.
SNR = 0.01;
x0 = sqrt(2*SNR);
sigsmall = wgn + x0*sin(2*pi/10*t);

[psigsmall,f] = plomb(sigsmall,t,[],ofac,'normalized');

hpsigsmall = histcounts(psigsmall,br)';

bar(bend,[hpsigsmall hRand]/Nf/dx,'histc')
hold on
plot(br,exp(-br))
legend('sigsmall','Empirical pdf','Theoretical pdf')
hold off

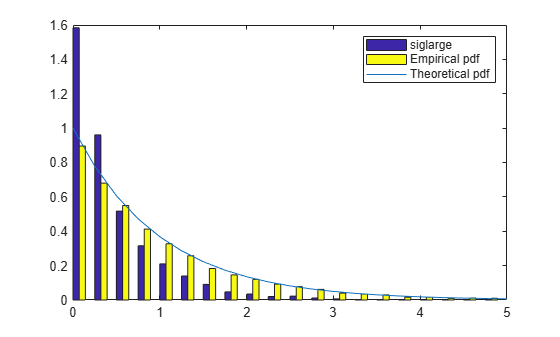
Repeat the calculation using . The distribution now differs noticeably.
SNR = 1;
x0 = sqrt(2*SNR);
siglarge = wgn + x0*sin(2*pi/10*t);

[psiglarge,f] = plomb(siglarge,t,[],ofac,'normalized');

hpsiglarge = histcounts(psiglarge,br)';

bar(bend,[hpsiglarge hRand]/Nf/dx,'histc')
hold on
plot(br,exp(-br))
legend('siglarge','Empirical pdf','Theoretical pdf')
hold off
Generate 100 samples of a sinusoidal signal at a sample rate of 1 Hz. Specify an amplitude of 0.75 and a frequency of . Embed the signal in white noise of variance 0.902. Reset the random number generator for repeatable results.
rng default

X0 = 0.75;
f0 = 0.6;
vr = 0.902;

Nsamp = 100;
t = 1:Nsamp;
X = X0*cos(f0*(1:Nsamp))+randn(1,Nsamp)*sqrt(vr);
Discard 10% of the samples at random. Plot the signal.
X(randperm(Nsamp,Nsamp/10)) = NaN;

plot(t,X,'o')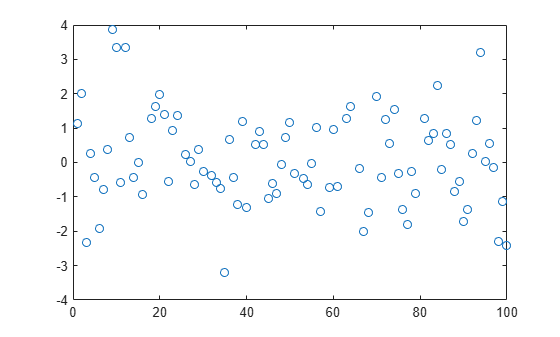
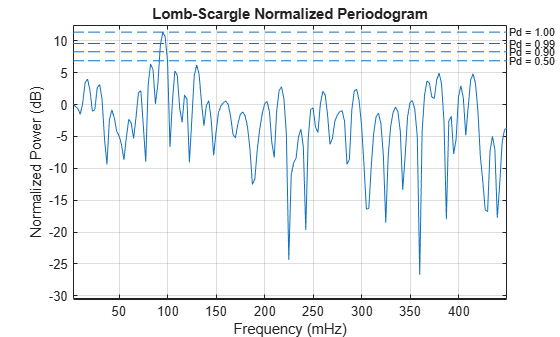
Compute and plot the normalized power spectrum. Annotate the levels that correspond to false-alarm probabilities of 50%, 10%, 1%, and 0.01%. If you generate many 90-sample white noise signals with variance 0.902, then half of them have one or more peaks higher than the 50% line, 10% have one or more peaks higher than the 10% line, and so on.
Pfa = [50 10 1 0.01]/100;
Pd = 1-Pfa;

[pxx,f,pth] = plomb(X,1:Nsamp,'normalized','Pd',Pd);

plot(f,pxx,f,pth*ones(size(f')))
xlabel('f')
text(0.3*[1 1 1 1],pth-.5,[repmat('P_{fa} = ',[4 1]) num2str(Pfa')])
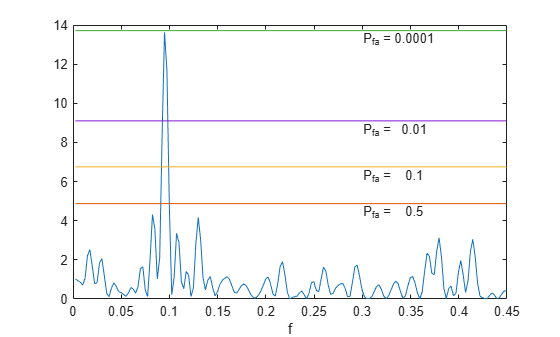
In this case, the peak is high enough that only about 0.01% of the possible signals can attain it.
Use plomb with no output arguments to repeat the calculation. The plot is now logarithmic, and the levels are drawn in terms of detection probabilities.
plomb(X,1:Nsamp,'normalized','Pd',Pd)
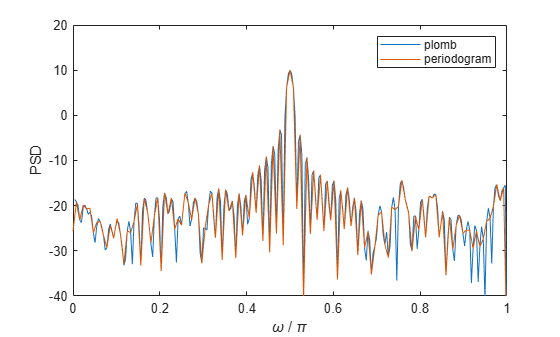
When given a data vector as the only input, plomb estimates the power spectral density using normalized frequencies.
Generate 128 samples of a sinusoid of normalized frequency rad/sample embedded in white Gaussian noise of variance 1/100.
t = (0:127)';
x = sin(2*pi*t/4);
x = x + randn(size(x))/10;
Estimate the PSD using the Lomb-Scargle procedure. Repeat the calculation with periodogram.
[p,f] = plomb(x);
[pper,fper] = periodogram(x);
Plot the PSD estimates in decibels. Verify that the results are equivalent.
plot(f/pi,pow2db(p))
hold on
plot(fper/pi,pow2db(pper))

axis([0 1 -40 20])
xlabel('\omega / \pi')
ylabel('PSD')
legend('plomb','periodogram')
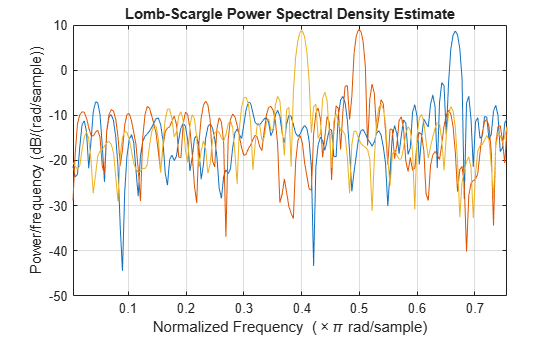
Estimate the Lomb-Scargle PSD of a three-channel signal composed of sinusoids. Specify the frequencies as rad/sample, rad/sample, and rad/sample. Add white Gaussian noise of variance 1/100. Use plomb with no output arguments to compute and plot the PSD estimate in decibels.
x3 = [sin(2*pi*t/3) sin(2*pi*t/4) sin(2*pi*t/5)];
x3 = x3 + randn(size(x3))/10;

figure
plomb(x3)

Compute the PSD estimate again, but now remove 25% of the data at random.
x3(randperm(numel(x3),0.25*numel(x3))) = NaN;

plomb(x3)
If you do not have a time vector, use NaN's to specify missing samples in a signal.
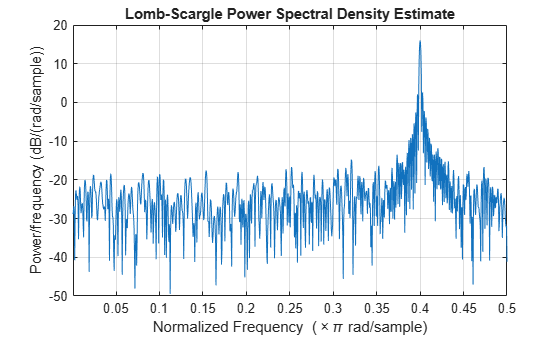
Generate 1024 samples of a sinusoid of normalized frequency rad/sample embedded in white noise of variance 1/100. Estimate the power spectral density using the Lomb-Scargle procedure. Use plomb with no output arguments to plot the estimate.
t = (0:1023)';
x = sin(2*pi*t/5);
x = x + randn(size(x))/10;

[pxx,f] = plomb(x);

plomb(x)
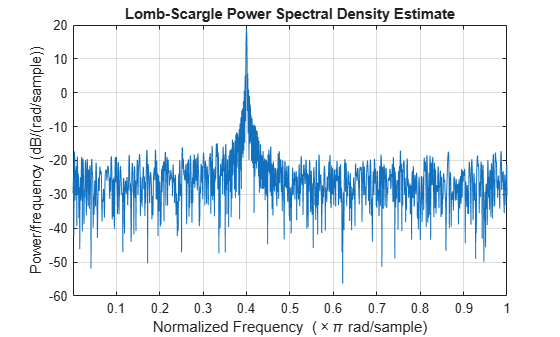
Remove every other sample by assigning NaN's. Use plomb to compute and plot the PSD. The periodogram peaks at the same frequency because the time axis is unchanged.
xnew = x;
xnew(2:2:end) = NaN;

plomb(xnew)
Remove every other sample by downsampling. The function now estimates the periodicity at twice the original frequency. This is probably not the result you want.
xdec = x(1:2:end);

plomb(xdec)

Input Arguments
Output Arguments
More About
References
[1] Horne, James H., and Sallie L. Baliunas. "A Prescription for Period Analysis of Unevenly Sampled Time Series." Astrophysical Journal. Vol. 302, 1986, pp. 757–763.
[2] Lomb, Nicholas R. "Least-Squares Frequency Analysis of Unequally Spaced Data." Astrophysics and Space Science. Vol. 39, 1976, pp. 447–462.
[3] Press, William H., and George B. Rybicki. "Fast Algorithm for Spectral Analysis of Unevenly Sampled Data." Astrophysical Journal. Vol. 338, 1989, pp. 277–280.
[4] Scargle, Jeffrey D. "Studies in Astronomical Time Series Analysis. II. Statistical Aspects of Spectral Analysis of Unevenly Spaced Data." Astrophysical Journal. Vol. 263, 1982, pp. 835–853.
Extended Capabilities
Version History
Introduced in R2014b