620 résultats
Converts 3D and 2D MATLAB plots to the scalable vector format (SVG).
Scalable Vector Graphics (SVG) Export of FiguresConverts 2D & 3D Matlab plots to the scalable vector format (SVG). This format is specified by W3C (http://www.w3.org) and can be viewed and

This function is not perfect yet, but it is better than any of the existing svg read functions.
path data in svg and calculates curves and lines. All lines and cubic Bézier curves are supported, but quadratic and elliptical curves are not yet supported (To be updated). It also does not support

Matlab fonctions to read and write SVG (Scalable Vector Graphic) files to and from Matlab structures
This contains Matlab code to load the content of an SVG file into a simple Matlab structure (loadSVG.m), to save a Matlab structure containing polygons and images into a SVG file (saveSVG.m) and a

RGB to color name. Color name to RGB. Supports many palettes: CSS, dvips, HTML, MATLAB, RAL, SVG, X11, xcolor, xkcd,...
' 'LeCorbusier' 'MacBeth' 'MATLAB' 'Natural' 'OsXCrayons' 'PicoMiteVGA' 'PptHighlight' 'PptStandard' 'PWG' 'R' 'RAL' 'Resene' 'Resistor' 'SherwinWilliams' 'SVG


Multi-Dimensional Data Visualization

Demos and files from the webinar

Performance of Differential Amplify-and-Forward Relaying in Multi-Node Wireless Communications
Version 1.1.0.0
matlabsharecodesPerformance of Differential Amplify-and-Forward Relaying in Multi-Node Wireless Communications

Differential MPSK over correlated Rayleigh fading channels

Matlab/GNU Octave Toolbox to Export Matlab/GNU Octave Figures in Scalable Vector Graphics (SVG) Format
fig2svg is a Matlab/GNU Octave toolbox that converts Matlab/GNU Octave figures to Scalable Vector Graphics (SVG). fig2svg was originally a fork of plot2svg

Quantification of fracture patterns in rocks and other materials
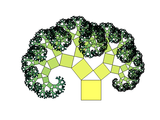
This function generates Pythagoras tree and exports the plot to SVG file.
Cross-platform WYSIWYG figure export from Matlab to SVG, PDF, PNG, EPS preserving transparency
FileExchange:- instant export to multiple formats, including PDF, SVG, EPS, PNG, while ensuring that all formats look identicalidentical output on multiple platforms (Linux and MacOS currently supported, Windows

Create SVG files in matlab
makesvgCreate SVG files in matlabThis software is designed to create SVG files usings matlab, made up of basic shapes and texts.It was written to create precise stimuli for running psychophysics /
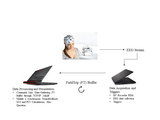
EEG brain-computer interface system for providing real-time speech entrainment neurofeedback

The Brick Toolbox is a set of utility functions for Matlab.
Make SVG file stretch with containing HTML element
Since R2014b, MATLAB can directly output graphics as SVG files (print -dpng). The generated figure has a fixed size. If you want to include this SVG on your website, you might want it to stretch to
JAABA: The Janelia Automatic Animal Behavior Annotator


Save figures in high quality PNG by saving them in SVG and exporting in PNG using Inkscape
resolution, images still look horrible.The best solution that I've found for exporting images in a nice way is saving them in SVG and exporting them to PNG using Inkscape, but this requires a lot of time. For

A button component for app designer apps that can be styled with an SVG icon
Description This is a button component for SVG based icons. This provides a way to use SVG based icons in a button and customize the icon color as well as some other properties to give the button

FGT is a tool to analyze rock fold geometry in 2D. It estimates material properties and shortening.

These functions help you to generate a tailor made pattern of a shirt based on simple body dimensions and gives advices on its fabrication.
shirt, which you can then be modified as you like.---Which kind of files do I get and how can I use the pattern to cut the fabric?The pattern can be written into a SVG-file or a DXF-file. This file can be

SVG plot for your stereographic representation.
Creates a Scalable Vector Graphic (SVG) file of the graphic where the orientation of three dimensional planes are represented in an equalangle spherical projection, normally used in structural


Flexible Statistics Data Analysis Toolbox
Exchange](https://www.mathworks.com/matlabcentral/images/matlab-file-exchange.svg)](https://www.mathworks.com/matlabcentral/fileexchange/72999-fsda)[](http://rosa.unipr.it/FSDA/guide.html

A MATLAB toolbox for exporting publication quality figures
) Variable image compression, including lossless (pdf, eps, jpg) Optional rounded line-caps (pdf, eps) Optionally append to file (pdf, tiff, gif) Vector formats: pdf, eps, emf, svgBitmap formats: png, tiff

Exports a figure as a pdf file in vector format for inclusion into LaTeX.

Connect MATLAB to Ollama™ (for local LLMs), OpenAI® Chat Completions API (which powers ChatGPT™), and Azure® OpenAI Services
# Large Language Models (LLMs) with MATLAB[](https://matlab.mathworks.com/open/github/v1

This function can be used to create various plots of Lab color coordinates.
points in the 3D Lab space.-> projected 3D plots illustrate the data points in a 3D space, but samples projected in the a*b*, L*a*, L*b* plane.Figures can be exported to scalable vector graphics (svg
Gaussian Process (GP) classifier for one-class, binary, and binomial classification
[
High-fidelity digital twins of Quanser’s world renowned controls, mechatronics, and robotics hardware for teaching and research.
Exchange](https://www.mathworks.com/matlabcentral/images/matlab-file-exchange.svg)](https://www.mathworks.com/matlabcentral/fileexchange/123860-quanser-interactive-labs-for-matlab)Download, install, and launch Quanser Interactive Labs from within MATLAB®Quanser Interactive Labs (QLabs) is a hardware-inspired, scalable way to bring credible, high-fidelity interactive lab experiences to

Additional app building components to efficiently develop advanced user interfaces in MATLAB
Exchange](https://www.mathworks.com/matlabcentral/images/matlab-file-exchange.svg)](https://www.mathworks.com/matlabcentral/fileexchange/83328)[](https://matlab.mathworks.com/open/github/v1

Easy to use, GUI based tool to capture, analyze, validate, postprocess, visualize and simulate PIV data. http://PIVlab.de
Online](https://www.mathworks.com/images/responsive/global/open-in-matlab-online.svg)](https://matlab.mathworks.com/open/github/v1?repo=Shrediquette/PIVlab&file=PIVlab_GUI.m)Thanks to the [thousands of publications that use PIVlab for

Analog Devices, Inc. Transceiver Toolbox
Version 23.2.2
Analog Devices, Inc. Systems Development GroupBoard support package for HDL targeting and data streaming from Analog Devices transceivers.
[](https://github.com/analogdevicesinc/TransceiverToolbox/blob/master/LICENSE)Latest Release : [](https://github.com/analogdevicesinc/TransceiverToolbox/releases/latest)Downloads :

gramm is a powerful and full-featured plotting and visualization toolbox similar to ggplot2 or seaborn
Exchange](https://www.mathworks.com/matlabcentral/images/matlab-file-exchange.svg)](https://mathworks.com/matlabcentral/fileexchange/54465-gramm-data-visualization-toolbox)Gramm is a MATLAB toolbox that enables the rapid creation of complex, publication-quality figures. Its design philosophy focuses on a *declarative* approach, where users specify the desired end result, as

Fork of Plot2LaTex.m by Jan de Jong
Exchange](https://www.mathworks.com/matlabcentral/images/matlab-file-exchange.svg)](https://de.mathworks.com/matlabcentral/fileexchange/108554-plot2latex)## Overview**PLOT2LATEX** saves matlab figure as a PDF file in vector format for inclusion into LaTeX. Requires free and open-source vector graphics editor Inkscape. This allows links of varible

MATLAB toolbox for control 101 course
Exchange](https://www.mathworks.com/matlabcentral/images/matlab-file-exchange.svg)](https://uk.mathworks.com/matlabcentral/fileexchange/130439-control-101-toolbox)MATLAB toolbox for control 101 courseThe community toolbox project is led by Anthony Rossiter with sponsorship from MathWorks (under project "A MATLAB community toolbox to support learning of Control 101
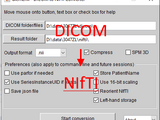
NIfTI conversion, visualization and transformation tools
Exchange](https://www.mathworks.com/matlabcentral/images/matlab-file-exchange.svg)](https://www.mathworks.com/matlabcentral/fileexchange/42997-xiangruili-dicm2nii)[](https://matlab.mathworks.com/open/github/v1?repo=xiangruili/dicm2nii)# dicm2niiConvert DICOM into

This function can be used to create various plots of errors related to Lab color coordinates.
; the figures can be exported to scalable vector graphics (svg) usoing 'plot2svg.m' by Juerg Schwizer

Learn Fourier analysis using live scripts and apps.
# Fourier Analysis[](https://www.mathworks.com/matlabcentral/fileexchange/106725-fourier-analysis) or

Interactive courseware module that addresses common foundational-level concepts taught in signal processing courses.
Exchange](https://www.mathworks.com/matlabcentral/images/matlab-file-exchange.svg)](https://www.mathworks.com/matlabcentral/fileexchange/97112-convolution-in-digital-signal-processing) or [](https://matlab.mathworks.com/open/github/v1

The MATLAB function pixelgrid shows the edges of image pixels.
[](https://www.mathworks.com/matlabcentral/fileexchange/71622-pixel-grid) [
MATLAB class and Simulink blocks for communicating with an Arduino board
Exchange](https://www.mathworks.com/matlabcentral/images/matlab-file-exchange.svg)](https://www.mathworks.com/matlabcentral/fileexchange/32374-legacy-matlab-and-simulink-support-for-arduino)Sample usage:------------------%-- connect to the boarda = arduino('COM9')%-- specify pin modea.pinMode(4,'input');a.pinMode(13,'output');%-- digital i/oa.digitalRead(4) % read pin 4a.digitalWrite(13,0) %

Planners and logic for offroad navigation of an autonomous haul truck in an open pit mine. Built for MATLAB R2023b.
Exchange](https://www.mathworks.com/matlabcentral/images/matlab-file-exchange.svg)](https://www.mathworks.com/matlabcentral/fileexchange/135472-offroad-navigation-for-autonomous-haul-trucks) Hauling material in an open pit mine requires a planning stack capable of both navigating at the global scale and avoiding obstacles during local path following. Navigation Toolbox™ offers planners

A vectorized, customizable method of plotting correlation dot plots in MATLAB.
[](https://zenodo.org/doi/10.5281/zenodo.10463403) [
Calculates CIExy coordinate of a light source using photo luminescence data and predict color.
http://en.wikipedia.org/wiki/File:CIExy1931.svg

Analog Devices, Inc. High Speed Converter Toolbox
Version 22.2.1.0
Analog Devices, Inc. Systems Development GroupBoard support package for HDL targeting and data streaming from Analog Devices transceivers.
[](https://github.com/analogdevicesinc/HighSpeedConverterToolbox/blob/master/LICENSE)Latest Release : [
Field-Oriented Control of Permanent Magnet Synchronous Motor Using NXP™ Development kits
Exchange](https://www.mathworks.com/matlabcentral/images/matlab-file-exchange.svg)](https://www.mathworks.com/matlabcentral/fileexchange/93535-field-oriented-control-of-pmsm-using-nxp-s32k144-kit)## Setup 1. Download the repository and extract the contents.2. For instructions to use the repository, see the documents under the respective folder.### [MathWorks

Connect and acquire biosignal data from the BITalino (r)evolution board and other BITalino (r)evolution Plugged kits.
Exchange](https://www.mathworks.com/matlabcentral/images/matlab-file-exchange.svg)](https://www.mathworks.com/matlabcentral/fileexchange/136004-matlab-support-for-bitalino-biosignal-devices) Use MATLAB Support for BITalino Biosignal Devices to connect and acquire biosignal data from the BITalino (r)evolution board and other BITalino (r)evolution Plugged kits.## Installation and Setup

Given the confusion matrix finds the two or multiclass metrics such as precision, recall, F1-score, and others.
Exchange](https://www.mathworks.com/matlabcentral/images/matlab-file-exchange.svg)](https://www.mathworks.com/matlabcentral/fileexchange/105825-multiclass-metrics-of-a-confusion-matrix) [](https://matlab.mathworks.com/open/github/v1

MATLAB example using deep learning to classify chronological age from brain MRI images
[](https://matlab.mathworks.com/open/github/v1

A MATLAB toolbox for interacting with the Allen Brain Observatory
[](https://matlab.mathworks.com/open/github/v1
Provides functions to retrieve data and metadata from providers that disseminate data by means of SDMX web services.
CI](https://github.com/amattioc/SDMX/actions/workflows/java-ci.yml/badge.svg?branch=master)](https://github.com/amattioc/SDMX/actions/workflows/java-ci.yml)[
A conventional vehicle electrical system model with alternator, battery, loads, and idle control.
Exchange](https://www.mathworks.com/matlabcentral/images/matlab-file-exchange.svg)](https://www.mathworks.com/matlabcentral/fileexchange/25674-automotive-electrical-system-simulation-and-control)[](https://matlab.mathworks.com/open/github/v1

Enable custom workflows for labeling volumes and isosurfaces in your MATLAB app.
Exchange](https://www.mathworks.com/matlabcentral/images/matlab-file-exchange.svg)](https://www.mathworks.com/matlabcentral/fileexchange/72723-volume-labeling-widgets-matlab-app-building-components) [](https://matlab.mathworks.com/open/github/v1

A collection of functions for 2D and 3D geometric computing (intersections, distance...) on various shapes: polygons, meshes, ellipsoids...
Exchange](https://www.mathworks.com/matlabcentral/images/matlab-file-exchange.svg)](https://fr.mathworks.com/matlabcentral/fileexchange/107370-matgeom)[](https://doi.org/10.5281/zenodo.5768192)**MatGeom** is a library for geometry processing / geometric computing with MATLAB in 2D and 3D. MatGeom is a “function-based” library: it contains several hundreds of functions for the

The Fill Between Area Curve creates a shaded area between two data series, effectively highlighting the region of overlap or difference.
Exchange](https://www.mathworks.com/matlabcentral/images/matlab-file-exchange.svg)](https://www.mathworks.com/matlabcentral/fileexchange/133622-fill-between-area-curve) [](https://matlab.mathworks.com/open/github/v1

read/write universal files using matlab/fortran
Exchange](https://www.mathworks.com/matlabcentral/images/matlab-file-exchange.svg)](https://se.mathworks.com/matlabcentral/fileexchange/110705-read-write-universal-files)

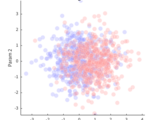
A scatter where the color (and/or transparency) of the markers indicates the density of points.
Exchange](https://www.mathworks.com/matlabcentral/images/matlab-file-exchange.svg)](https://www.mathworks.com/matlabcentral/fileexchange/95828-densityscatterchart)[](https://matlab.mathworks.com/open/github/v1
Vous pouvez également sélectionner un site web dans la liste suivante :
Amériques
- América Latina (Español)
- Canada (English)
- United States (English)
Europe
- Belgium (English)
- Denmark (English)
- Deutschland (Deutsch)
- España (Español)
- Finland (English)
- France (Français)
- Ireland (English)
- Italia (Italiano)
- Luxembourg (English)
- Netherlands (English)
- Norway (English)
- Österreich (Deutsch)
- Portugal (English)
- Sweden (English)
- Switzerland
- United Kingdom(English)
Asie-Pacifique
- Australia (English)
- India (English)
- New Zealand (English)
- 中国
- 日本Japanese (日本語)
- 한국Korean (한국어)