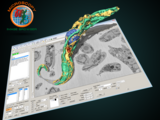
Microscopy Image Browser (MIB)
MIB is a package for segmentation of multi-dimensional (2D-4D) microscopy datasets
herehttp://se.mathworks.com/matlabcentral/fileexchange/63402-microscopy-image-browser-2--mib2-With MIB you can analyse, segment and visualize various multidimensional datasets from both light and electron microscopy. See more further details and tutorials on MIB website
- 1,3K (depuis toujours)
- 3 (30 derniers jours)
- 5,0 / 5
- Communauté
-
9 fév. 2019

Microscopy Image Browser 2 (MIB2)
MIB2 is an update package for segmentation of multi-dimensional (2D-4D) microscopy datasets
With MIB2 you can analyse, segment and visualize various multidimensional datasets from both light and electron microscopy. MIB2 is completely rewritten to follow MVC architecture and brings
- 2,4K (depuis toujours)
- 6 (30 derniers jours)
- 5,0 / 5
- Communauté
-
2 juil. 2026

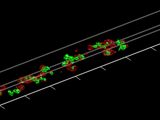
High-Throughput, Algorithmic Determination of Nanoparticle Structure from Electron Microscopy Images
Automated analysis of electron microscopy images (PC and Mac versions available.)
. Chem. Soc. 2014, 136, 7603 doi: 10.1021/ja503509kHigh-Throughput, Algorithmic Determination of Nanoparticle Structure from Electron Microscopy ImagesChristine R. Laramy, Keith A. Brown, Matthew N
- 847 (depuis toujours)
- 4 (30 derniers jours)
- 5,0 / 5
- Communauté
-
25 avr. 2017
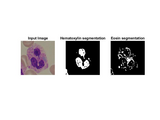
Segmentation of WBC in microscopy images
Stain deconvolution followed by threshold based segmentation is used.
- 207 (depuis toujours)
- 1 (30 derniers jours)
- 5,0 / 5
- Communauté
-
21 nov. 2021

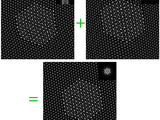
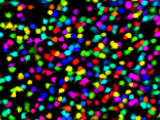
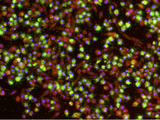
Synthetic Bright-Field Microscopy Image Generator
This is a synthetic image generation tool that can create realistic Pap-smear images
This is a simulator able to procedurally create realistic bright-field microscopy images depicting Pap-smears. The principles used in the simulation are described in the paper "Simulation of
- 621 (depuis toujours)
- 3 (30 derniers jours)
- 5,0 / 5
- Communauté
-
12 mars 2015

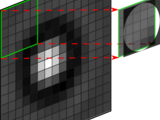
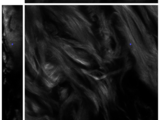
Filter noise and interpolate microscopy images in frequency domain
Remove spatial frequencies beyond the optical cutoff and perform physically accurate interpolation.
. Filtering the spatial frequencies beyond the optical cutoff provides simple yet effective means of reducing noise. Since microscopy data is band-limited, padding in frequency domain provides accurate
- 881 (depuis toujours)
- 1 (30 derniers jours)
- 5,0 / 5
- Communauté
-
1 mars 2013
Nonlinear Drift Correction from Scanning Probe Microscopy (SPM) Orthogonal Image Pairs
Correct nonlinear drift distortions in scanning probe images.
This collection of scripts is intended to correct nonlinear drift distortions in images recorded using any scanning probe microscopy technique (where there is a slow and a fast scan direction). It
- 566 (depuis toujours)
- 2 (30 derniers jours)
- 5,0 / 5
- Communauté
-
26 fév. 2016
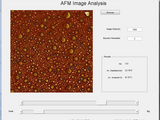
Atomic Force Microscopy Image Analysis
This is the software to analysis the atomic force microscopy images. Average feature size and area can be calculated using this software. Steps to follow - 1 - First remove any additional part of the
- 2,6K (depuis toujours)
- 2 (30 derniers jours)
- 5,0 / 5
- Communauté
-
7 déc. 2010
Read .dm3 and .dm4 image files
Read Digital Micrograph files for electron microscopy
- 3K (depuis toujours)
- 15 (30 derniers jours)
- 5,0 / 5
- Communauté
-
20 sept. 2013
Imagic, MRC, DM and STAR file i/o
Functions for reading and writing image files and STAR files for electron microscopy
This directory contains m-functions for reading and writing files used in electron microscopy and 3D reconstruction. The file formats those used by the IMAGIC software package (Image Science GmbH
- 4K (depuis toujours)
- 7 (30 derniers jours)
- 5,0 / 5
- Communauté
-
6 jan. 2019
Image to Volume Conversion for Representing Materials Topography
Converts a single image (microscopy, topogrpahy) into array of images.
- 3,8K (depuis toujours)
- 1 (30 derniers jours)
- 5,0 / 5
- Communauté
-
17 nov. 2003
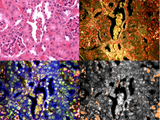
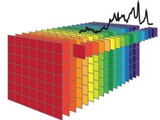
Machine learning assisted hyperspectral imaging
Automatic detection of nanoparticles using hyperspectral microscopy and machine learning
Automatic detection of nanoparticles using hyperspectral microscopyNanoparticles are used extensively as biomedical imaging probes and potential therapeutic agents. As new particles are developed and
- 730 (depuis toujours)
- 4 (30 derniers jours)
- 5,0 / 5
- Communauté
-
20 avr. 2017
Computationally Enhanced Quantitative Phase Microscopy
Toolbox for the ceQPM method
. "Computationally Enhanced Quantitative Phase Microscopy Reveals Autonomous Oscillations in Mammalian Cell Growth." bioRxiv (2019): 631119.The image processing pipeline includes:1. load the experiment information2
- 75 (depuis toujours)
- 1 (30 derniers jours)
- -- / 5
- Communauté
-
6 mai 2020
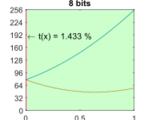
Transmittance limit for Digital Holographic Microscopy
Estimates and plots the transmittance limit for a digital hologram in a 1-bit to 16-bit representation for the given setup parameters.
Retrieval of accurate phase maps from Digital Holographic Microscopy (DHM) is highly dependent on the representation of the carrier fringe pattern in the digital sensor. Physically, the contrast of
- 21 (depuis toujours)
- 1 (30 derniers jours)
- -- / 5
- Communauté
-
24 jan. 2024

Noise evaluation in transmission electron microscopy (TEM)
Scrips for evalutating the important noise parameters and correlations in TEM. Reconstruction of the point spread function from signal noise
microscopy.Sci Rep 15, 3815 (2025).https://doi.org/10.1038/s41598-025-85982-4So, if you use any of these scripts for your evaluations please cite the above paper.Please note, however, that the authors disclaim any
- 13 (depuis toujours)
- 2 (30 derniers jours)
- -- / 5
- Communauté
-
16 juin 2025

GUI for displaying image stacks, e.g. time-resolved or z-stacked microscopy images.
- 1,8K (depuis toujours)
- 1 (30 derniers jours)
- 5,0 / 5
- Communauté
-
1 sept. 2011

- 313 (depuis toujours)
- 2 (30 derniers jours)
- -- / 5
- Communauté
-
11 sept. 2024

This is a tutorial demonstrating how to access open microscopy data and publish reusable and reproducible analyses in MATLAB
Analyse Open Microscopy Data in MATLAB®A MATLAB Live Script with accompanyingJupyter® Notebook,m fileandreproducible code capsule on Code Ocean®to access and analyze Microscopy image data sets from
- 25 (depuis toujours)
- 1 (30 derniers jours)
- -- / 5
- Communauté
-
14 mars 2024
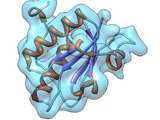
A Bayesian Adaptive Basis Algorithm for Single Particle Reconstruction
3D reconstruction algorithm for electron cryo-microscopy.
a Bayesian maximum-a-posteriori framework and uses an efficient optimization algorithm for the maximization. Evaluations using simulated and actual cryogenic electron microscopy data show resolution
- 939 (depuis toujours)
- 1 (30 derniers jours)
- -- / 5
- Communauté
-
5 avr. 2012
SubspaceEM: A Fast Maximum-a-posteriori Algorithm for Cryo-EM Single Particle Reconstruction
Fast alignment and reconstruction algorithm for cryo-electron microscopy
cryo-electron microscopy images and the structure projections, greatly reducing the number of image transformations and comparisons that are computed. The files include an implementation of the SubspaceEM
- 415 (depuis toujours)
- 1 (30 derniers jours)
- -- / 5
- Communauté
-
18 mars 2015
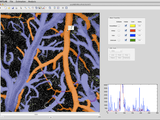
Segment the vessel branches from dynamic image of fluorescent microscopy
Segment the blood vessels from a dynamic image of fluorescent microscopy. == Install ======- Add all attached files to matlab path- Download "Better Skeletonization" from following URL and add to
- 2,3K (depuis toujours)
- 1 (30 derniers jours)
- -- / 5
- Communauté
-
5 avr. 2012
Particle localisation using local gradients
Local_gradientsThis package provides a set of tools for 3-D localisation of single particles in brightfield and fluorescent microscopy using local gradients.The package is provided in LabVIEW, Matlab
- 37 (depuis toujours)
- 2 (30 derniers jours)
- -- / 5
- Communauté
-
9 nov. 2022

Allows users to view a tiff stack (useful for time-lapse microscopy datasets)
- 495 (depuis toujours)
- 1 (30 derniers jours)
- -- / 5
- Communauté
-
19 fév. 2015

Segmentation of neurons in microscopy images
Set up, train and apply a neural network for segmentation of neurons in microscopy images.
- 64 (depuis toujours)
- 1 (30 derniers jours)
- -- / 5
- Communauté
-
13 août 2021
Hyperspectral CARS Image Analysis
Hyperspectral CARS microscopy and spectroscopy toolbox
Hyperspectral CARS microscopy and spectroscopy toolbox allows researchers easy analysis of their data.Toolbox focuses on image fusion, denoising and spectroscopy.
- 743 (depuis toujours)
- 1 (30 derniers jours)
- 2,0 / 5
- Communauté
-
23 sept. 2014

Optical Point Spread Function generator (with aberrations)
3D PSF of a microscopy objective starting Focal length, stop size and numerical aperture. Includes Aberrations, and illumination properties.
- 86 (depuis toujours)
- 4 (30 derniers jours)
- -- / 5
- Communauté
-
19 sept. 2024
GUI for detection of cells for Integrated Light and Electron Microscopy
GUI for detection of fluorescent cells in In-Resin Fluorescence sections
Matlab GUI for automated detection of fluorescent cells in In-Resin Fluorescence sections for Integrated Light and Electron Microscopy
- 102 (depuis toujours)
- 1 (30 derniers jours)
- -- / 5
- Communauté
-
12 fév. 2018
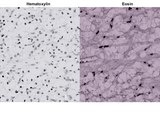
Stain Deconvolution is used to determine Stain density Estimation in H&E microscopy images
- 73 (depuis toujours)
- 1 (30 derniers jours)
- 5,0 / 5
- Communauté
-
21 nov. 2021
Measure Myelin-to-Axon Diameter
The M-file is to calculate the g-ratio for Scanning or Transmission Electronic Microscopy.
- 277 (depuis toujours)
- 1 (30 derniers jours)
- 5,0 / 5
- Communauté
-
6 jan. 2017
Composites fibre orientation from one cross section
Computes the 2nd order orientation tensor diagonal from an optical or scanning electron micrograph
- 288 (depuis toujours)
- 1 (30 derniers jours)
- 2,5 / 5
- Communauté
-
27 juin 2016
Automated Analysis of Platelet Aggregation in Microfluidics
Automatic thresholding of fluorescence microscopy images in microfluidics to determine platelet coverage and aggregate size distribution.
- 43 (depuis toujours)
- 1 (30 derniers jours)
- -- / 5
- Communauté
-
18 nov. 2019

MATLAB code for a Graphic User Interface dedicated to automatically count and quantify dendritic spines from fluorescence microscopy images
MATLAB code for a Graphic User Interface dedicated to automatically count and quantify dendritic spines from fluorescence microscopy images. It has been tested with .oib files from
- 59 (depuis toujours)
- 1 (30 derniers jours)
- -- / 5
- Communauté
-
18 nov. 2020
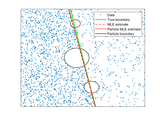
Interface detection in point cloud data (SRM & SMLM)
Code for detecting interfaces in super-resolution microscopy (SRM) data. Also works for other types of Poisson-distributed point cloud data.
SMLM_interface_detectionCode for detecting interfaces in super-resolution microscopy (SRM) data,typically single-molecule localization microscopy (SMLM).The code provided here is under Copyright ©
- 6 (depuis toujours)
- 1 (30 derniers jours)
- -- / 5
- Communauté
-
10 avr. 2022
3D-Reconstruction algorithm used for N-way FRET microscopy
- 182 (depuis toujours)
- 1 (30 derniers jours)
- 1,0 / 5
- Communauté
-
28 déc. 2015

AxonSeg is a GUI that performs axon and myelin segmentation on histology images.
Segment axon and myelin from microscopy data. Written in Matlab. The compiled versions are also available for those who do not have the necessary processing toolboxes.
- 1,7K (depuis toujours)
- 3 (30 derniers jours)
- 5,0 / 5
- Communauté
-
12 juin 2019

Time-lapse microscopy classification of 2D cells based on cell shape (Seiler et al., TERM, 2012)
- 1,3K (depuis toujours)
- 1 (30 derniers jours)
- 1,0 / 5
- Communauté
-
16 juil. 2012

STXM Spectromicroscopy Particle Analysis Routines
Spectromicroscopic analysis of atmospheric nanoparticles (aerosols)
An automated data analysis method for atmospheric particles using scanning transmission X-ray microscopy coupled with near edge X-ray fine structure spectroscopy (STXM/NEXAFS). This method is applied
- 1,3K (depuis toujours)
- 1 (30 derniers jours)
- 5,0 / 5
- Communauté
-
19 oct. 2010
Automatic spatial drift correction of images or video frames.
each image frame aligned. An instruction manual has been submitted to Microscopy Today and will hopefully be published in the near future.
- 908 (depuis toujours)
- 1 (30 derniers jours)
- 5,0 / 5
- Communauté
-
10 fév. 2014
Finds, summarizes, and plots (if desired) 2-color colocalization from 3D images.
This script allows the user to load 3-D TIFF images, such as those derived from confocal or 2-photon microscopy, into the MATLAB workspace for analysis of colocalization between two images in 3-D
- 2,7K (depuis toujours)
- 3 (30 derniers jours)
- 5,0 / 5
- Communauté
-
18 août 2004
Fast, complete two-photon pipeline
- 783 (depuis toujours)
- 8 (30 derniers jours)
- 5,0 / 5
- Communauté
-
18 août 2016
Best Infocus Image from Image Stack
This code Find out the best infocus image from a image stack using Tamura coefficient.
This matlab code implements Tamura Coefficient to find out the best infocus image in the stack of the images.The stack of the microscopy has many images but one of the image is the best
- 66 (depuis toujours)
- 2 (30 derniers jours)
- 5,0 / 5
- Communauté
-
26 déc. 2019

Leica image format file loader
Read and preview of Leica's image format file.
- 1,1K (depuis toujours)
- 3 (30 derniers jours)
- 4,7 / 5
- Communauté
-
4 avr. 2012

Save Matlab data from SPM/AFM scans for use with Gwyddion
What is Gwyddion?"Gwyddion is a modular program for SPM (scanning probe microscopy) data visualization and analysis. Primarily it is intended for analysis of height fields obtained by scanning probe
- 592 (depuis toujours)
- 5 (30 derniers jours)
- 4,8 / 5
- Communauté
-
22 avr. 2014

Basic (demo) 2-photon microscope scanning software
- 194 (depuis toujours)
- 1 (30 derniers jours)
- 5,0 / 5
- Communauté
-
16 avr. 2024

Scalebar for images and plots
example](src/examples/createImageExample.m) creates thefollowing pseudocoloured microscopy image and adds a 25 µm scale bar. From therepository root, run it with:```matlabaddpath("src/examples")createImageExample``` ### Plot dataThe
- 730 (depuis toujours)
- 14 (30 derniers jours)
- 5,0 / 5
- Communauté
-
16 juil. 2026

STXM data analysis script collection - STACKLab
STXM data analysis script collection with stack exploration GUI tool STACKLab
This is a MATLAB script collection developed at Lawrence Berkeley National Lab that can be used as a basis for Scanning Transmission X-ray Microscopy (STXM) data analysis. It includes routines for
- 1,8K (depuis toujours)
- 1 (30 derniers jours)
- 5,0 / 5
- Communauté
-
13 juil. 2009

Control ZEN Blue and the microscope from MATLAB
Control the ZEN Blue microscope control software from within a MATLAB script
- 357 (depuis toujours)
- 2 (30 derniers jours)
- 5,0 / 5
- Communauté
-
19 sept. 2016

Read ROIs and ROI sets saved from ImageJ into MATLAB, without java.
- 4,6K (depuis toujours)
- 18 (30 derniers jours)
- 4,9 / 5
- Communauté
-
16 août 2017
DM3 Import for Gatan Digital Micrograph
Imports Gatan .DM3 format files with tags (images, spectra, & spectral images) into a MATLAB struct.
This script acts to import files from Gatan's .DM3 file format, utilized for electron microscopy, into a MATLAB structure. The fields of the MATLAB structure can then be referenced with the
- 2,7K (depuis toujours)
- 4 (30 derniers jours)
- 5,0 / 5
- Communauté
-
8 jan. 2013

AFM point-mass model with DMT tip-sample interaction
AFM point-mass Simulink model with DMT interaction. Outputs amplitude & phase observables. Packaged as AFM_by_JRR for MATLAB.
benchmarked against literature, specifically adapted from:Page 211 of García, R. and Pérez, R., 2002. Dynamic atomic force microscopy methods. Surface Science Reports, 47(6-8), pp.197-301.What’s Included in the
- 3 (depuis toujours)
- 3 (30 derniers jours)
- -- / 5
- Communauté
-
9 juil. 2026
Script package for quantifying bacterial load within cells using images from an ArrayScan microscope
This package includes a variety of scripts for analysis of microscopy images, using the SAFIRE screening platform. This package is useful for analyzing high-content screens of intracellular bacteria
- 46 (depuis toujours)
- 1 (30 derniers jours)
- -- / 5
- Communauté
-
20 fév. 2017
Reads and imports Asylum Research ARDF files to Matlab structures for force curve analysis.
For atomic force microscopy force curve analysis within Matlab. Reads Asylum Research Data Files (.ARDF).readARDF() reads image, note, and other data from the ARDF file into a Matlab
- 250 (depuis toujours)
- 3 (30 derniers jours)
- 5,0 / 5
- Communauté
-
15 mars 2024
Nikon ND2 File Reader
- 904 (depuis toujours)
- 2 (30 derniers jours)
- 4,5 / 5
- Communauté
-
25 avr. 2019
Current version only accept gray-scale images. Just format your image stack into a 3D array.
A good tool to display all kinds of 3D image stacksLSM (Laser scanning microscopy) imagesCT scan (x-ray) imagesMRI imagesConfocal microscopy imagesOCT (optical coherence tomography) images
- 1,4K (depuis toujours)
- 1 (30 derniers jours)
- -- / 5
- Communauté
-
25 oct. 2012
Read and write files in SPIDER format
SPIDER is a free image processing system for electron microscopy. It is used for three-dimensional reconstruction of single particle macromolecules, multivariate statistical classification, and
- 903 (depuis toujours)
- 1 (30 derniers jours)
- 4,0 / 5
- Communauté
-
19 mai 2009

Radially averaged surface roughness/topography power spectrum (PSD)
Calculates radially averaged 2D power spectrum for a surface roughness/topography
surface topography, which the topography is normally obtained by any 3D profilometry techniques, such as AFM (Atomic Force Microscopy), WLI (White Light Interferometry) and many other optical profilers. As
- 3,5K (depuis toujours)
- 6 (30 derniers jours)
- 4,9 / 5
- Communauté
-
19 déc. 2016
Diffusion gradient vector field in 3D
Generate in 3D the diffusion gradient vector field as in Xu and Prince 1998
usage:[un vn wn] = dgvf_calc(I,sqrt(numel(I)), 0.5, 1, 1, 1, 1)Note: The code was developed with 3d flourescence microscopy images in mind (bright objects against dark background). Enforcement of boundary
- 920 (depuis toujours)
- 1 (30 derniers jours)
- 5,0 / 5
- Communauté
-
6 jan. 2014

Novel Retinal Vessel Segmentation Algorithm: Fundus Images
The algorithm presented here segments retinal blood vessels with a high degree of accuracy.
of Fungal Hyphae in Macroscopic Microscopy Image Stacks." arXiv preprint arXiv:1704.02356 (2017).Saranya, M., and A. Grace Selvarani. "Fundus Image Screening for Diabetic Retinopathy." Indian Journal
- 8,7K (depuis toujours)
- 4 (30 derniers jours)
- 4,6 / 5
- Communauté
-
25 mars 2019

Medical Imaging Toolbox Interface for Cellpose Library
Use Cellpose library in MATLAB
Segment cells from microscopy images using the Medical Imaging Toolbox™ Interface for Cellpose Library. The support package provides functionality for downloading pretrained models from the Cellpose
- 492 (depuis toujours)
- 3 (30 derniers jours)
- -- / 5
- MathWorks
-
22 juil. 2026

DiffractIndex is a simple program for measuring diffraction ring diameters from TEM or XRD patterns
- 937 (depuis toujours)
- 2 (30 derniers jours)
- 4,2 / 5
- Communauté
-
7 jan. 2016